

【Multiple Entry Basis】A pullback buy signal at the noticeable high on the higher timeframe, with resistance/support turned and mBDSR (RCI 2-series filter).
0
Indicator that excels in combination with RCI: BODSOR and mBDSR
Methods and Case Studies (PDF) ★GogoJungle AWARD 2020 Winner★
https://www.gogojungle.co.jp/tools/indicators/11836
USD/JPY 5-minute chart
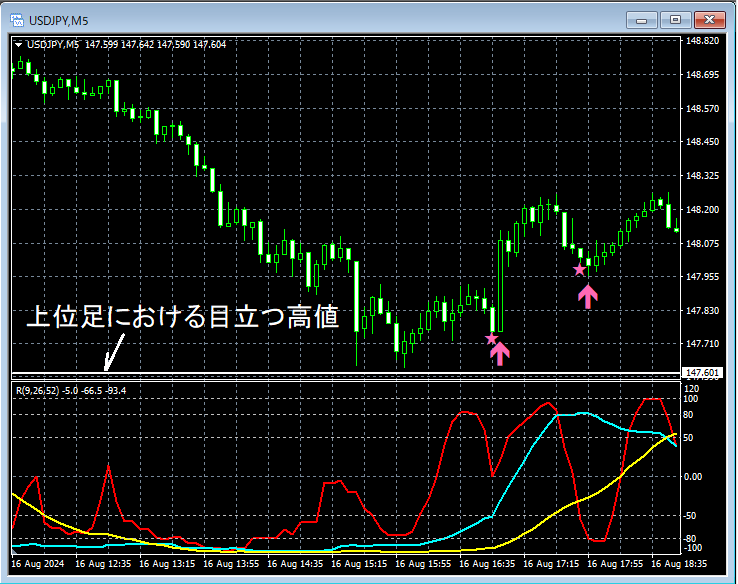
Regarding the higher timeframe conditions, omitted. On the above 5-minute chart,notable high on the higher timeframedecreased toward the vicinity and rebounded. After that,mBDSR (RCI two-line filter) pullback buy signallights up, and the price is rising smoothly (so-calledsupport/resistance conversion).
Rebound near notable high on the higher timeframeandmBDSR (RCI two-line filter) pullback buy signal litoverlap as multiple entry bases,可以說 overlapped.
From this example,a trading method focusing on noticeable highs and support/resistance conversionandthe signals of mBDSRshow strong compatibility.
Note: In the charts presented in this article, for convenience of explanation, circles, straight lines, and rectangles may be drawn.
Indicator that excels in combination with RCI: BODSOR and mBDSR
Methods and Case Studies (PDF) ★GogoJungle AWARD 2020 Winner★
https://www.gogojungle.co.jp/tools/indicators/11836
The PDF file includes 341 files (over 1,200 pages, over 430,000 characters).
Many of them aresummaries that logically link multiple higher and lower timeframes using the three-line RCI to consider the status of several lower timeframes step by step, ultimately waiting for pullbacks in the lower timeframe or timing of reversals (i.e., mBDSR signals)..
Additionally,many focus on identifying points where multiple entry bases overlap..
Furthermore,there are also methods that explore ascent and descent targets using three-line RCI..
In the PDF descriptions,over 1,200 chartsare used.

Methods and Case Studies (PDF) ★GogoJungle AWARD 2020 Winner★
https://www.gogojungle.co.jp/tools/indicators/11836
USD/JPY 5-minute chart
Regarding the higher timeframe conditions, omitted. On the above 5-minute chart,notable high on the higher timeframedecreased toward the vicinity and rebounded. After that,mBDSR (RCI two-line filter) pullback buy signallights up, and the price is rising smoothly (so-calledsupport/resistance conversion).
Rebound near notable high on the higher timeframeandmBDSR (RCI two-line filter) pullback buy signal litoverlap as multiple entry bases,可以說 overlapped.
From this example,a trading method focusing on noticeable highs and support/resistance conversionandthe signals of mBDSRshow strong compatibility.
Note: In the charts presented in this article, for convenience of explanation, circles, straight lines, and rectangles may be drawn.
Indicator that excels in combination with RCI: BODSOR and mBDSR
Methods and Case Studies (PDF) ★GogoJungle AWARD 2020 Winner★
https://www.gogojungle.co.jp/tools/indicators/11836
The PDF file includes 341 files (over 1,200 pages, over 430,000 characters).
Many of them aresummaries that logically link multiple higher and lower timeframes using the three-line RCI to consider the status of several lower timeframes step by step, ultimately waiting for pullbacks in the lower timeframe or timing of reversals (i.e., mBDSR signals)..
Additionally,many focus on identifying points where multiple entry bases overlap..
Furthermore,there are also methods that explore ascent and descent targets using three-line RCI..
In the PDF descriptions,over 1,200 chartsare used.
× ![]()


