

[Multiple Entry Reasons] Noticeable high price, resistance-turned-support, and mBDSR (RCI2 two-filter) pullback/buy signal
An indicator that shows its power when combined with RCI: 【BODSOR・mBDSR】
Methods & Case Studies (PDF) ★GogoJungle AWARD 2020 Winner★
https://www.gogojungle.co.jp/tools/indicators/11836
AUDCAD 1-Hour Chart
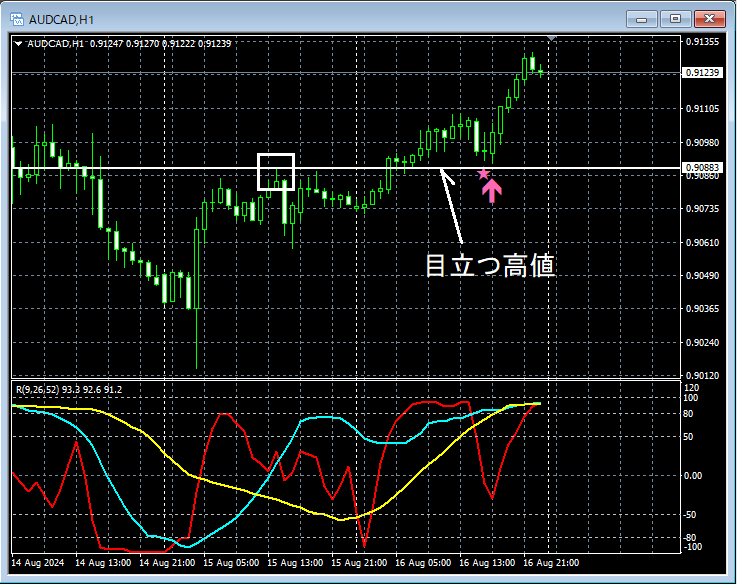
On the hourly chart above,a notable high nearhas fallen close to,mBDSR (2 RCI lines) pullback buy signallights up, and prices then rise steadily from right after (commonlysupport-turned-resistance).
A drop near the notable highandthe pullback buy signal of mBDSR (RCI 2 lines)overlap as multiple entry reasons.
From this example,a trading method that focuses on notable highs and support/resistance turnsandthe signals of mBDSRshow high compatibility.
※Please note that for convenience, charts described in this article may include added circles, straight lines, squares, etc.
An indicator that shows its power when combined with RCI: 【BODSOR・mBDSR】
Methods & Case Studies (PDF) ★GogoJungle AWARD 2020 Winner★
https://www.gogojungle.co.jp/tools/indicators/11836
PDF files include 341 items (over 1,200 pages, over 430,000 characters).
Many of them are summaries of examples that logically link higher and lower timeframes using 3 RCI lines, and ultimately wait for pullbacks or returns signals on the lower timeframe (i.e., mBDSR signals).
Additionally,many entries focus on pinpointing points where multiple entry bases overlap..
Also included are methods to explore upside and downside targets using three RCI lines.
In the PDF explanations,over 1,200 chartsare used.

Methods & Case Studies (PDF) ★GogoJungle AWARD 2020 Winner★
https://www.gogojungle.co.jp/tools/indicators/11836
AUDCAD 1-Hour Chart
On the hourly chart above,a notable high nearhas fallen close to,mBDSR (2 RCI lines) pullback buy signallights up, and prices then rise steadily from right after (commonlysupport-turned-resistance).
A drop near the notable highandthe pullback buy signal of mBDSR (RCI 2 lines)overlap as multiple entry reasons.
From this example,a trading method that focuses on notable highs and support/resistance turnsandthe signals of mBDSRshow high compatibility.
※Please note that for convenience, charts described in this article may include added circles, straight lines, squares, etc.
An indicator that shows its power when combined with RCI: 【BODSOR・mBDSR】
Methods & Case Studies (PDF) ★GogoJungle AWARD 2020 Winner★
https://www.gogojungle.co.jp/tools/indicators/11836
PDF files include 341 items (over 1,200 pages, over 430,000 characters).
Many of them are summaries of examples that logically link higher and lower timeframes using 3 RCI lines, and ultimately wait for pullbacks or returns signals on the lower timeframe (i.e., mBDSR signals).
Additionally,many entries focus on pinpointing points where multiple entry bases overlap..
Also included are methods to explore upside and downside targets using three RCI lines.
In the PDF explanations,over 1,200 chartsare used.
× ![]()


