

[Multiple Entry Evidence] A pullback selling signal during a decline: a double top, moving average, and mBDSR (RCI two-line filter).
0
An indicator that demonstrates power in combination with RCI: BODSOR・mBDSR
Methods and Case Studies (PDF) ★GogoJungle AWARD2020 Winner★
https://www.gogojungle.co.jp/tools/indicators/11836
WTI Crude Oil 4-Hour Chart
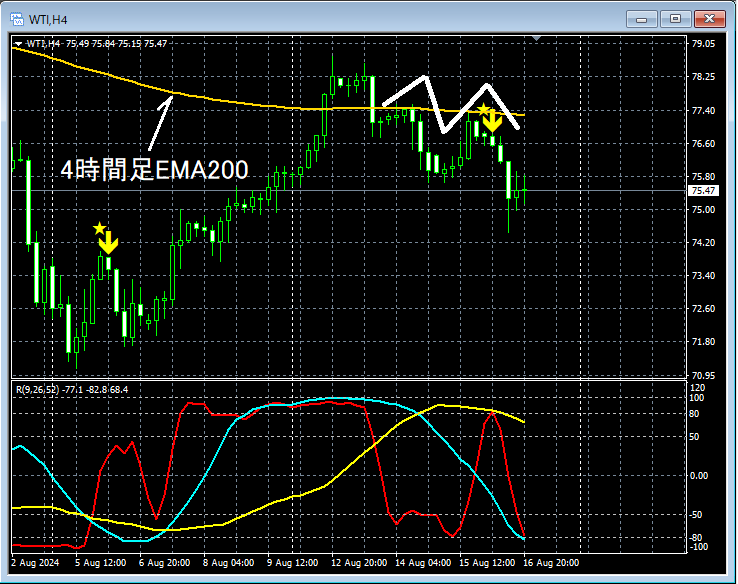
On the four-hour chart above, during the decline it temporarily acted as resistance4-Hour EMA200The price rose again near this level,mBDSR (Filter: RCI26 and RCI52) Sell Signallighting up, and subsequently the price has been dropping steadily.
Additionally, note that the sell signal lights up on the right peak of the double top during the decline.
From this example,a trading method that focuses on moving averages and the double top during declinesandthe signals of mBDSRshow a strong synergy.
*Please note that in the charts presented in this article, for convenience of explanation, annotations such as circles, straight lines, and squares may be added.
An indicator that demonstrates power in combination with RCI: BODSOR・mBDSR
Methods and Case Studies (PDF) ★GogoJungle AWARD2020 Winner★
https://www.gogojungle.co.jp/tools/indicators/11836
The PDF file includes 341 items (over 1,200 pages, over 430,000 characters).
Most of them are compiled as examples where, by linking the higher and lower timeframes logically using three RCI lines, the status of multiple lower timeframes is examined sequentially, ultimately waiting for pullbacks or retracements on the lower timeframes (i.e., the mBDSR signals).
Also,many of them focus on identifying points where multiple entry reasons overlap..
Additionally,there are methods that explore upside and downside targets using three RCI lines..
In the descriptions within the PDF files,more than 1,200 chartsare used.

Methods and Case Studies (PDF) ★GogoJungle AWARD2020 Winner★
https://www.gogojungle.co.jp/tools/indicators/11836
WTI Crude Oil 4-Hour Chart
On the four-hour chart above, during the decline it temporarily acted as resistance4-Hour EMA200The price rose again near this level,mBDSR (Filter: RCI26 and RCI52) Sell Signallighting up, and subsequently the price has been dropping steadily.
Additionally, note that the sell signal lights up on the right peak of the double top during the decline.
From this example,a trading method that focuses on moving averages and the double top during declinesandthe signals of mBDSRshow a strong synergy.
*Please note that in the charts presented in this article, for convenience of explanation, annotations such as circles, straight lines, and squares may be added.
An indicator that demonstrates power in combination with RCI: BODSOR・mBDSR
Methods and Case Studies (PDF) ★GogoJungle AWARD2020 Winner★
https://www.gogojungle.co.jp/tools/indicators/11836
The PDF file includes 341 items (over 1,200 pages, over 430,000 characters).
Most of them are compiled as examples where, by linking the higher and lower timeframes logically using three RCI lines, the status of multiple lower timeframes is examined sequentially, ultimately waiting for pullbacks or retracements on the lower timeframes (i.e., the mBDSR signals).
Also,many of them focus on identifying points where multiple entry reasons overlap..
Additionally,there are methods that explore upside and downside targets using three RCI lines..
In the descriptions within the PDF files,more than 1,200 chartsare used.
× ![]()


