

[Multiple Entry Basis] Focused Moving Averages and the mBDSR (RCI two-filter) Buy-the-Dip Signal
【Mastering RCI!! Trend Reversals, Buy on Dip, Sell on Rise】
An indicator that shines when used in combination with RCI【BODSOR・mBDSR】
and its method and case studies (PDF) ★GogoJungle AWARD2020 winner★
https://www.gogojungle.co.jp/tools/indicators/11836
NZD/JPY on the 5-minute chart
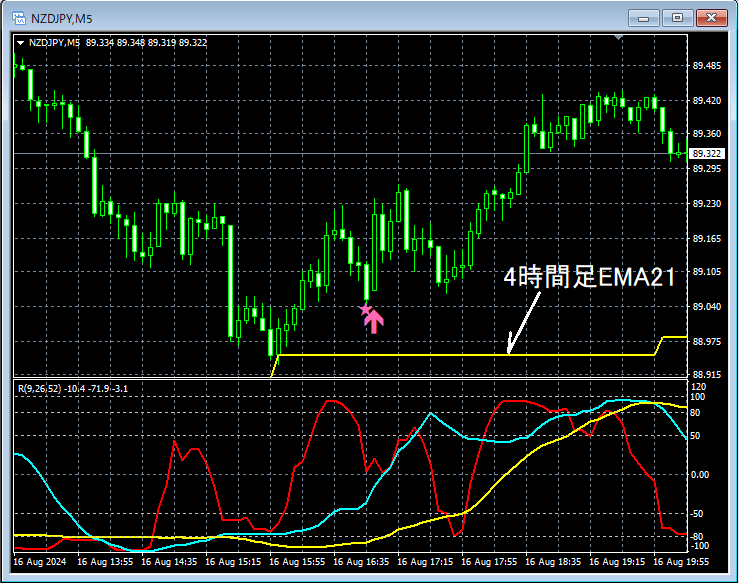
The status of the higher time frame is omitted. On the above 5-minute chart, the following are emphasizedNearby EMA21 on the 4-hour chartrebounding. After that,mBDSR (RCI dual-filter) buy-the-dip signallights up and the price rises steadily.
Rebound near an important moving averageandthe mBDSR buy-the-dip signal activationoverlap as multiple entry reasons, indicating strong alignment.
From this example,a trading method focused on important moving averagesandthe signal of mBDSRshow a high degree of compatibility.
※Please note that in the charts introduced in this article, for ease of explanation, circles, lines, and rectangles may be drawn.
An indicator that shines when used in combination with RCI【BODSOR・mBDSR】
and its method and case studies (PDF) ★GogoJungle AWARD2020 winner★
https://www.gogojungle.co.jp/tools/indicators/11836
The PDF file includes 341 files (over 1,200 pages, over 430,000 words in total).
Many of them are summarized as examples that logically link higher and lower time frames using three RCI lines, sequentially considering the status of multiple lower time frames, and ultimately waiting for a dip buy or a pullback sell timing (i.e., the signals of mBDSR) on the lower time frame.
Also,many highlight points where multiple entry reasons overlapare included.
Additionally,there are methods to explore upward or downward targets using three RCI lines.Also included.
In the PDF explanations,over 1,200 chartsare used.

An indicator that shines when used in combination with RCI【BODSOR・mBDSR】
and its method and case studies (PDF) ★GogoJungle AWARD2020 winner★
https://www.gogojungle.co.jp/tools/indicators/11836
NZD/JPY on the 5-minute chart
The status of the higher time frame is omitted. On the above 5-minute chart, the following are emphasizedNearby EMA21 on the 4-hour chartrebounding. After that,mBDSR (RCI dual-filter) buy-the-dip signallights up and the price rises steadily.
Rebound near an important moving averageandthe mBDSR buy-the-dip signal activationoverlap as multiple entry reasons, indicating strong alignment.
From this example,a trading method focused on important moving averagesandthe signal of mBDSRshow a high degree of compatibility.
※Please note that in the charts introduced in this article, for ease of explanation, circles, lines, and rectangles may be drawn.
An indicator that shines when used in combination with RCI【BODSOR・mBDSR】
and its method and case studies (PDF) ★GogoJungle AWARD2020 winner★
https://www.gogojungle.co.jp/tools/indicators/11836
The PDF file includes 341 files (over 1,200 pages, over 430,000 words in total).
Many of them are summarized as examples that logically link higher and lower time frames using three RCI lines, sequentially considering the status of multiple lower time frames, and ultimately waiting for a dip buy or a pullback sell timing (i.e., the signals of mBDSR) on the lower time frame.
Also,many highlight points where multiple entry reasons overlapare included.
Additionally,there are methods to explore upward or downward targets using three RCI lines.Also included.
In the PDF explanations,over 1,200 chartsare used.
× ![]()


