

[Multiple Entry Reasons] The buy signal on dips that emphasizes the moving averages, double bottom, and mBDSR (RCI two-filter)
0
【Mastering RCI!! Trend Reversal, Buy on Dips, Sell on Rallies】
Indicator that delivers power when combined with RCI【BODSOR・mBDSR】
and methods and case studies (PDF) ★GogoJungle AWARD2020 winner★
https://www.gogojungle.co.jp/tools/indicators/11836
EURJPY 5-minute chart
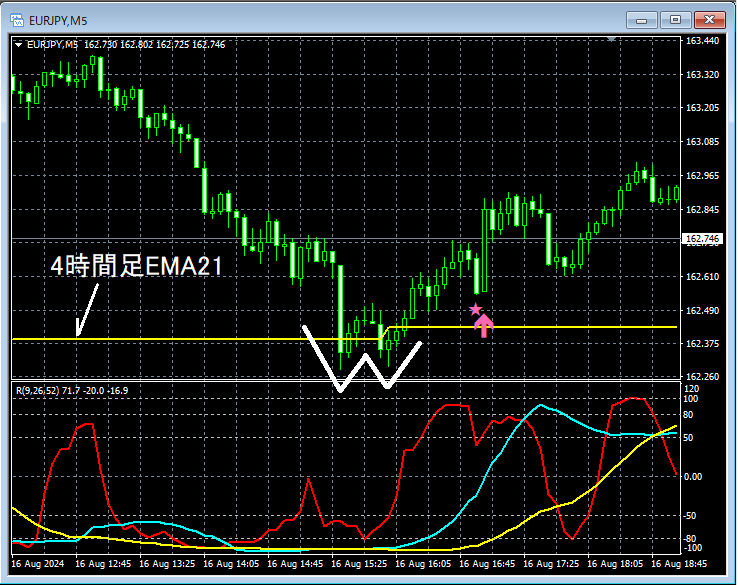
The higher-timeframe is omitted. On the upper 5-minute chart, the following are important4-hour EMA21which is clearly broken belowDouble bottomand rebounds. After that,mBDSR (RCI two-filter) Buy-on-dip signallights up and the price rises firmly.
Rebound near the key moving averageandRebound from the double bottomandmBDSR Buy-on-dip signallighting up, indicating multiple entry grounds overlap.
From this example,a trading method focusing on key moving averages and the double bottomandthe compatibility with mBDSR signals
※Please note that in this article's included charts, for readability, circles, lines, and rectangles may be drawn.
Indicator that delivers power when combined with RCI【BODSOR・mBDSR】
and methods and case studies (PDF) ★GogoJungle AWARD2020 winner★
https://www.gogojungle.co.jp/tools/indicators/11836
The PDF file includes 341 items (over 1,200 pages, over 430,000 characters in total).
Many of them are focused on using the RCI three-line setup to logically link higher and lower timeframes, gradually examining multiple lower-timeframe conditions, and finally waiting for a dip buy or a rally sell timing on the lower timeframes (i.e., the mBDSR signals).
Also,there are many that emphasize capturing points where multiple entry grounds overlap..
Furthermore,there are methods that explore upside/downside targets using the RCI three-line setup..
In the PDF explanations,over 1,200 chartsare used.

Indicator that delivers power when combined with RCI【BODSOR・mBDSR】
and methods and case studies (PDF) ★GogoJungle AWARD2020 winner★
https://www.gogojungle.co.jp/tools/indicators/11836
EURJPY 5-minute chart
The higher-timeframe is omitted. On the upper 5-minute chart, the following are important4-hour EMA21which is clearly broken belowDouble bottomand rebounds. After that,mBDSR (RCI two-filter) Buy-on-dip signallights up and the price rises firmly.
Rebound near the key moving averageandRebound from the double bottomandmBDSR Buy-on-dip signallighting up, indicating multiple entry grounds overlap.
From this example,a trading method focusing on key moving averages and the double bottomandthe compatibility with mBDSR signals
※Please note that in this article's included charts, for readability, circles, lines, and rectangles may be drawn.
Indicator that delivers power when combined with RCI【BODSOR・mBDSR】
and methods and case studies (PDF) ★GogoJungle AWARD2020 winner★
https://www.gogojungle.co.jp/tools/indicators/11836
The PDF file includes 341 items (over 1,200 pages, over 430,000 characters in total).
Many of them are focused on using the RCI three-line setup to logically link higher and lower timeframes, gradually examining multiple lower-timeframe conditions, and finally waiting for a dip buy or a rally sell timing on the lower timeframes (i.e., the mBDSR signals).
Also,there are many that emphasize capturing points where multiple entry grounds overlap..
Furthermore,there are methods that explore upside/downside targets using the RCI three-line setup..
In the PDF explanations,over 1,200 chartsare used.
× ![]()


