

[Multiple Entries Basis] Retracement high of higher timeframe and the return selling signal of mBDSR (RCI2 lines filter)
【Mastering RCI!! Trend Reversals, Buy on Dips, Sell on Rallies】
An indicator that shines in combination with RCI【BODSOR・mBDSR】
and method・case studies (PDF) ★GogoJungle AWARD2020 winner★
https://www.gogojungle.co.jp/tools/indicators/11836
Canadian Dollar / Japanese Yen CADJPY 1-minute chart
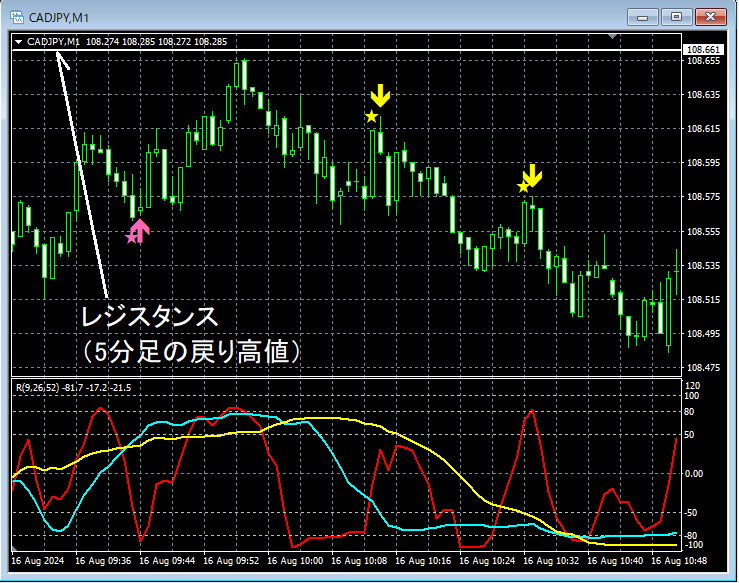
On the 1-minute chart above,cannot break above the return-high (5-minute level)and reverses. During the downward move,the mBDSR (two RCI filters) sell-on-rally signallights up at a timely moment.
Reversal from near the higher time frame return-highandthe mBDSR sell-on-rally signal litoverlap as multiple entry reasons.
From this example,the trade method that focuses on return-highs (Dow Theory)andthe signal of mBDSRshow strong compatibility.
※Please note that in the charts introduced in this article, for convenience of explanation, circles, lines, and rectangles may be drawn.
An indicator that shines in combination with RCI【BODSOR・mBDSR】
and method・case studies (PDF) ★GogoJungle AWARD2020 winner★
https://www.gogojungle.co.jp/tools/indicators/11836
The PDF file includes 341 items (over 1,200 pages, over 430,000 characters in total).
Most of them are summarised as follows: by using three RCI lines to logically link higher and lower timeframes, the situations of multiple lower timeframes are considered sequentially, and finally the timing for dip-buying or rally-sell timing on the lower timeframes (i.e., the signal of mBDSR) is worked out.
Additionally,there are many cases focusing on capturing points where multiple entry reasons coincide..
Furthermore,there are also methods for exploring upside targets and downside targets using three RCI lines..
In the description within the PDF file,over 1,200 chartsare used.

An indicator that shines in combination with RCI【BODSOR・mBDSR】
and method・case studies (PDF) ★GogoJungle AWARD2020 winner★
https://www.gogojungle.co.jp/tools/indicators/11836
Canadian Dollar / Japanese Yen CADJPY 1-minute chart
On the 1-minute chart above,cannot break above the return-high (5-minute level)and reverses. During the downward move,the mBDSR (two RCI filters) sell-on-rally signallights up at a timely moment.
Reversal from near the higher time frame return-highandthe mBDSR sell-on-rally signal litoverlap as multiple entry reasons.
From this example,the trade method that focuses on return-highs (Dow Theory)andthe signal of mBDSRshow strong compatibility.
※Please note that in the charts introduced in this article, for convenience of explanation, circles, lines, and rectangles may be drawn.
An indicator that shines in combination with RCI【BODSOR・mBDSR】
and method・case studies (PDF) ★GogoJungle AWARD2020 winner★
https://www.gogojungle.co.jp/tools/indicators/11836
The PDF file includes 341 items (over 1,200 pages, over 430,000 characters in total).
Most of them are summarised as follows: by using three RCI lines to logically link higher and lower timeframes, the situations of multiple lower timeframes are considered sequentially, and finally the timing for dip-buying or rally-sell timing on the lower timeframes (i.e., the signal of mBDSR) is worked out.
Additionally,there are many cases focusing on capturing points where multiple entry reasons coincide..
Furthermore,there are also methods for exploring upside targets and downside targets using three RCI lines..
In the description within the PDF file,over 1,200 chartsare used.
× ![]()


