

[Multiple entry basis] Sign of the bullish candlestick, counter-trend line, the moving average that is regarded as important, and mBDSR (RCI two-filter)
Indicator that shines in combination with RCI【BODSOR・mBDSR】
Methods, cases study (PDF) ★GogoJungle AWARD2020 winner★
https://www.gogojungle.co.jp/tools/indicators/11836
AUDCHF on Australia Swiss, 30-minute chart
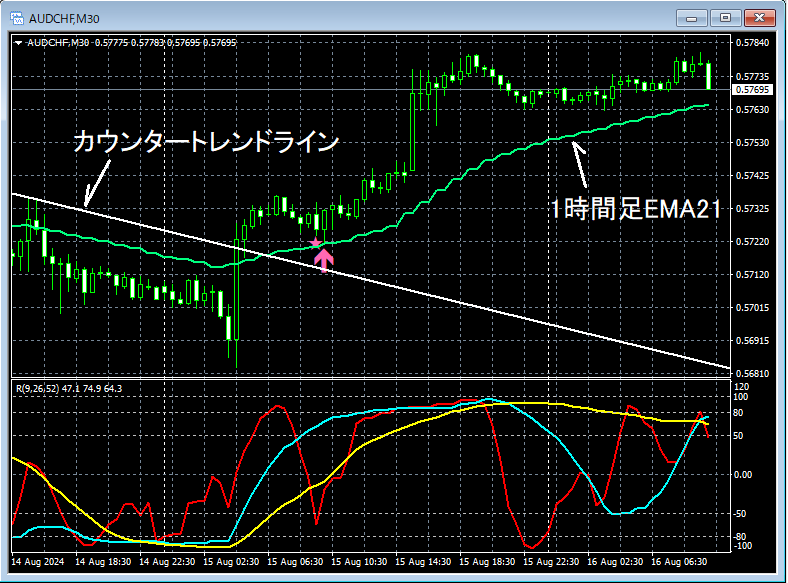
In the 30-minute chart above,a strong bullish candleforms,the counter-trend lineandthe 1-hour EMA21are broken upward. After that, as it dropped towardthe vicinity of the 1-hour EMA21,the mBDSR (RCI two-line filter) pullback buy signallit up and price resumed its rise.
Appearance of a bullish candleandbreak above the counter-trend lineandbreak above the important moving averagesandandpullback to near the important moving averagesthe mBDSR (RCI two-line filter) pullback buy signal lighting upall overlap as multiple entry confirmations.
AUDCHF on Australia Swiss, 5-minute chart
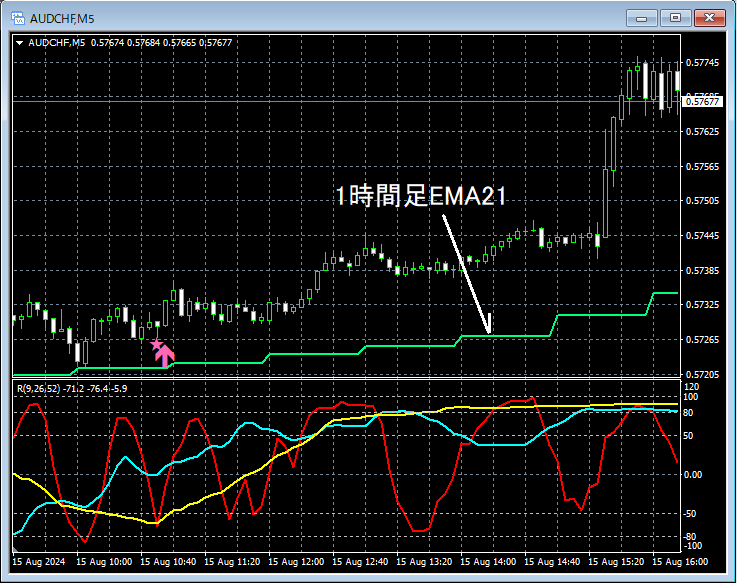
Additionally, on the 5-minute chart above, after the signal lit on the 30-minute chart,the mBDSR (RCI two-line filter) pullback buy signallit up, and price has risen from immediately after. In this 5-minute chart example, by placing the stop-loss slightly below the most recent low, arisk-reward favorable tradeis possible.
From this example,it can be seen that a trading method focusing on bullish candles, counter-trend lines, and moving averagesandthe signals of mBDSRhave a high degree of compatibility.
※ Please note that in the charts shown in this article, for convenience of explanation, circles, straight lines, squares, etc. may have been added.
Indicator that shines in combination with RCI【BODSOR・mBDSR】
Methods, cases study (PDF) ★GogoJungle AWARD2020 winner★
https://www.gogojungle.co.jp/tools/indicators/11836
The PDF file includes 333 files (over 1,200 pages, over 420,000 characters in total).
Many of them aresummaries of cases where multiple timeframes are logically linked using the RCI three-line setup to sequentially examine multiple lower-timeframe conditions, ultimately waiting for a pullback buy or a retrace sell timing (i.e., the mBDSR signals) on the lower timeframes..
Also,many of them emphasize identifying points where multiple entry confirmations coincide..
Additionally,there are methods that explore upside and downside targets using three-line RCI..
In the explanations within the PDF files,over 1,200 chartsare used.

Methods, cases study (PDF) ★GogoJungle AWARD2020 winner★
https://www.gogojungle.co.jp/tools/indicators/11836
AUDCHF on Australia Swiss, 30-minute chart
In the 30-minute chart above,a strong bullish candleforms,the counter-trend lineandthe 1-hour EMA21are broken upward. After that, as it dropped towardthe vicinity of the 1-hour EMA21,the mBDSR (RCI two-line filter) pullback buy signallit up and price resumed its rise.
Appearance of a bullish candleandbreak above the counter-trend lineandbreak above the important moving averagesandandpullback to near the important moving averagesthe mBDSR (RCI two-line filter) pullback buy signal lighting upall overlap as multiple entry confirmations.
AUDCHF on Australia Swiss, 5-minute chart
Additionally, on the 5-minute chart above, after the signal lit on the 30-minute chart,the mBDSR (RCI two-line filter) pullback buy signallit up, and price has risen from immediately after. In this 5-minute chart example, by placing the stop-loss slightly below the most recent low, arisk-reward favorable tradeis possible.
From this example,it can be seen that a trading method focusing on bullish candles, counter-trend lines, and moving averagesandthe signals of mBDSRhave a high degree of compatibility.
※ Please note that in the charts shown in this article, for convenience of explanation, circles, straight lines, squares, etc. may have been added.
Indicator that shines in combination with RCI【BODSOR・mBDSR】
Methods, cases study (PDF) ★GogoJungle AWARD2020 winner★
https://www.gogojungle.co.jp/tools/indicators/11836
The PDF file includes 333 files (over 1,200 pages, over 420,000 characters in total).
Many of them aresummaries of cases where multiple timeframes are logically linked using the RCI three-line setup to sequentially examine multiple lower-timeframe conditions, ultimately waiting for a pullback buy or a retrace sell timing (i.e., the mBDSR signals) on the lower timeframes..
Also,many of them emphasize identifying points where multiple entry confirmations coincide..
Additionally,there are methods that explore upside and downside targets using three-line RCI..
In the explanations within the PDF files,over 1,200 chartsare used.
× ![]()


