

【Multiple Entry Bases】Pin Bar, Inside Bar, Double Bottom, and mBDSR (RCI2 lines filter) Buy Signal
Indicator that shines in combination with RCI: BODSOR・mBDSR
Methods and Case Studies (PDF) ★GogoJungle AWARD 2020 Recipient★
https://www.gogojungle.co.jp/tools/indicators/11836
Bitcoin / USD BTCUSD 4-hour chart
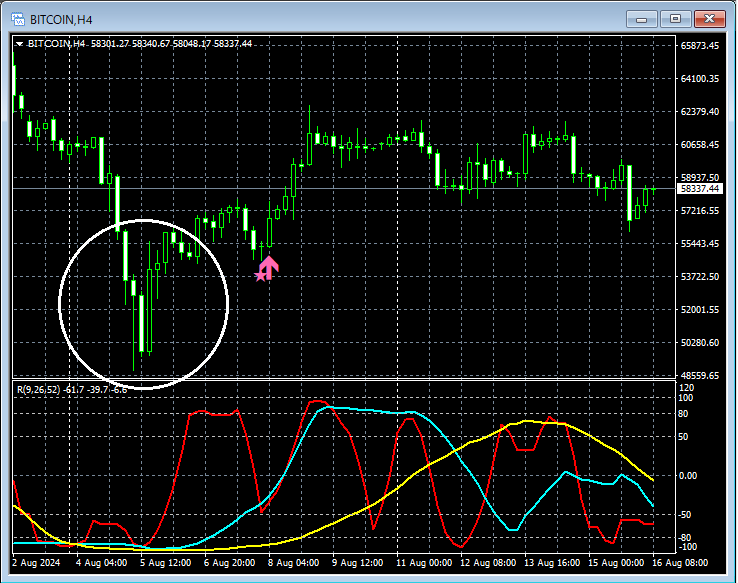
Looking at the area circled in white on the 4-hour chart above, it suggests an upward movePin Bar (long lower wick)andEngulfingappear, making it a scenario where a pullback buy on lower timeframes wouldn’t be surprising.
Bitcoin / USD BTCUSD 30-minute chart
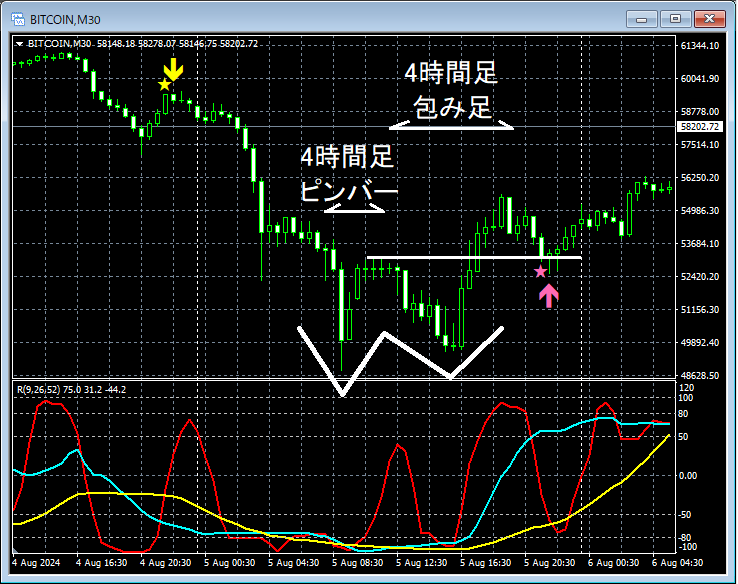
Looking at the above 30-minute chart,Double Bottomto form a rebound. On the 4-hour chart,Engulfingappears,Double BottomandNecklineapproached,mBDSR (Two RCI lines filter) pullback buy signal
Pin Bar appearsandEngulfing appearsanddecline to near the Double Bottom neck lineandmBDSR pullback buy signal lights upoverlapping as multiple entry raisons d’être.
From this example,there is strong compatibility between trades focused on pin bars, engulfing patterns, and double bottomsandmBDSR signals.
Note: In this article, charts introduced may have added circles, lines, or squares for explanatory convenience.
Indicator that shines in combination with RCI: BODSOR・mBDSR
Methods and Case Studies (PDF) ★GogoJungle AWARD 2020 Recipient★
https://www.gogojungle.co.jp/tools/indicators/11836
The PDF file contains 333 items (over 1,200 pages, over 420,000 words).
Many of them are 集成 of cases where, by logically linking multiple higher- and lower-timeframe charts using the three RCI lines, the situations of several lower timeframes are examined step by step, ultimately waiting for pullbacks or reversals on the lower timeframe (i.e., the mBDSR signal).
Additionally,.
Furthermore,.
In the descriptions within the PDF files,are used.

Methods and Case Studies (PDF) ★GogoJungle AWARD 2020 Recipient★
https://www.gogojungle.co.jp/tools/indicators/11836
Bitcoin / USD BTCUSD 4-hour chart
Looking at the area circled in white on the 4-hour chart above, it suggests an upward movePin Bar (long lower wick)andEngulfingappear, making it a scenario where a pullback buy on lower timeframes wouldn’t be surprising.
Bitcoin / USD BTCUSD 30-minute chart
Looking at the above 30-minute chart,Double Bottomto form a rebound. On the 4-hour chart,Engulfingappears,Double BottomandNecklineapproached,mBDSR (Two RCI lines filter) pullback buy signal
Pin Bar appearsandEngulfing appearsanddecline to near the Double Bottom neck lineandmBDSR pullback buy signal lights upoverlapping as multiple entry raisons d’être.
From this example,there is strong compatibility between trades focused on pin bars, engulfing patterns, and double bottomsandmBDSR signals.
Note: In this article, charts introduced may have added circles, lines, or squares for explanatory convenience.
Indicator that shines in combination with RCI: BODSOR・mBDSR
Methods and Case Studies (PDF) ★GogoJungle AWARD 2020 Recipient★
https://www.gogojungle.co.jp/tools/indicators/11836
The PDF file contains 333 items (over 1,200 pages, over 420,000 words).
Many of them are 集成 of cases where, by logically linking multiple higher- and lower-timeframe charts using the three RCI lines, the situations of several lower timeframes are examined step by step, ultimately waiting for pullbacks or reversals on the lower timeframe (i.e., the mBDSR signal).
Additionally,.
Furthermore,.
In the descriptions within the PDF files,are used.
× ![]()


