

【Multiple Entry Basis】Bearish signals in Elliott Wave with Failer and mBDSR (RCI two-filter) return sale signal
Indicator that Showcases Power in Combination with RCI: BODSOR and mBDSR
Method and Case Studies (PDF) ★GogoJungle AWARD2020 Winner★
https://www.gogojungle.co.jp/tools/indicators/11836
EURGBP 30-minute chart
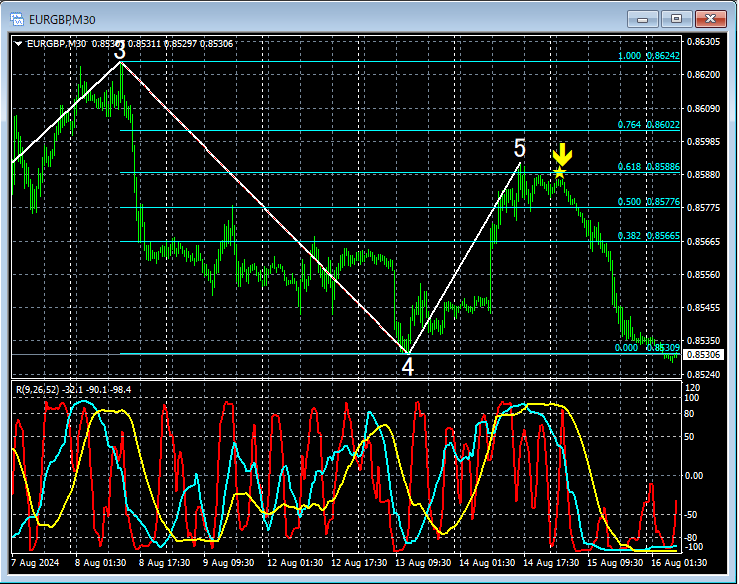
The above 30-minute chart displays the 1-hour chart’sElliott Countapplied to Wave 4Fibonacci Retracementwhile watching,the 5th wave of the risepotentially ends at theFallerlevel, suggesting a possible reversal.
Looking at the subsequent chart,the 5th wave of the risethe timing of the drop after its completion ismBDSR (RCI two-line filter) sell signalthat well captures the move.
From this example,a trading approach focusing on reversals in Elliott Waveandthe signals of mBDSRshow a strong compatibility.
※Please note that in the charts introduced in this article, for convenience of explanation, circles, straight lines, squares, and other shapes may be drawn.
Indicator that Showcases Power in Combination with RCI: BODSOR and mBDSR
Method and Case Studies (PDF) ★GogoJungle AWARD2020 Winner★
https://www.gogojungle.co.jp/tools/indicators/11836
The PDF file includes 328 items (over 1,200 pages, over 410,000 characters).
Most of them are examples that break down the process of logically linking higher and lower timeframes by using three RCI lines, examining multiple lower-timeframe conditions sequentially, and ultimately waiting for buy-on-dips or sell-on-rallies signals on the lower timeframe (i.e., mBDSR signals).
Additionally,many entries focus on identifying points where multiple entry rationales overlap.
Furthermore,there are methods that explore upward and downward targets using three RCI lines.
In the PDF explanations,more than 1,200 chartsare used.

Method and Case Studies (PDF) ★GogoJungle AWARD2020 Winner★
https://www.gogojungle.co.jp/tools/indicators/11836
EURGBP 30-minute chart
The above 30-minute chart displays the 1-hour chart’sElliott Countapplied to Wave 4Fibonacci Retracementwhile watching,the 5th wave of the risepotentially ends at theFallerlevel, suggesting a possible reversal.
Looking at the subsequent chart,the 5th wave of the risethe timing of the drop after its completion ismBDSR (RCI two-line filter) sell signalthat well captures the move.
From this example,a trading approach focusing on reversals in Elliott Waveandthe signals of mBDSRshow a strong compatibility.
※Please note that in the charts introduced in this article, for convenience of explanation, circles, straight lines, squares, and other shapes may be drawn.
Indicator that Showcases Power in Combination with RCI: BODSOR and mBDSR
Method and Case Studies (PDF) ★GogoJungle AWARD2020 Winner★
https://www.gogojungle.co.jp/tools/indicators/11836
The PDF file includes 328 items (over 1,200 pages, over 410,000 characters).
Most of them are examples that break down the process of logically linking higher and lower timeframes by using three RCI lines, examining multiple lower-timeframe conditions sequentially, and ultimately waiting for buy-on-dips or sell-on-rallies signals on the lower timeframe (i.e., mBDSR signals).
Additionally,many entries focus on identifying points where multiple entry rationales overlap.
Furthermore,there are methods that explore upward and downward targets using three RCI lines.
In the PDF explanations,more than 1,200 chartsare used.
× ![]()


