

[Multiple Entry Bases] Sign of a large bearish candle, support at the current low, the moving average being considered important, and the mBDSR (RCI two-filter) signals
Indicator that shines in combination with RCI: BODSOR・mBDSR
Methods, cases, and studies (PDF) ★GogoJungle AWARD2020 winner★
https://www.gogojungle.co.jp/tools/indicators/11836
Euro/Aussie EURAUD 30-minute chart
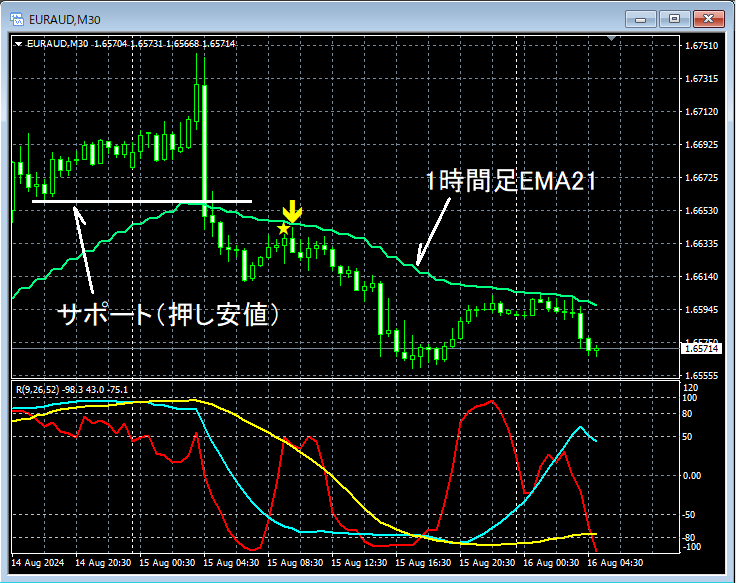
In the 30-minute chart above,a large bearish candleforms,the support level andis broken. After that, when it returns close to thearea,lights up and price resumes its decline.
Occurrence of a large bearish candleandandandandare all overlapping entry reasons.
From this example,andshow high compatibility.
※Please note that in the charts introduced in this article, for convenience of explanation, circles, straight lines, and squares may have been added.
Indicator that shines in combination with RCI: BODSOR・mBDSR
Methods, cases, and studies (PDF) ★GogoJungle AWARD2020 winner★
https://www.gogojungle.co.jp/tools/indicators/11836
The PDF file includes 333 items (over 1,200 pages, over 420,000 characters in total).
Many of these are summaries of examples where multiple lower timeframes are logically linked with higher timeframes using three RCI lines, ultimately interpreting the lower timeframes to wait for buy-the-dounce (pullback) or sell-the-rally timings (i.e., mBDSR signals).
Additionally,there are many that emphasize capturing points where multiple entry reasons overlap..
Furthermore,the method of exploring upside targets and downside targets using the three RCI linesis also included.
In the PDF explanations,over 1,200 chartsare used.

Methods, cases, and studies (PDF) ★GogoJungle AWARD2020 winner★
https://www.gogojungle.co.jp/tools/indicators/11836
Euro/Aussie EURAUD 30-minute chart
In the 30-minute chart above,a large bearish candleforms,the support level andis broken. After that, when it returns close to thearea,lights up and price resumes its decline.
Occurrence of a large bearish candleandandandandare all overlapping entry reasons.
From this example,andshow high compatibility.
※Please note that in the charts introduced in this article, for convenience of explanation, circles, straight lines, and squares may have been added.
Indicator that shines in combination with RCI: BODSOR・mBDSR
Methods, cases, and studies (PDF) ★GogoJungle AWARD2020 winner★
https://www.gogojungle.co.jp/tools/indicators/11836
The PDF file includes 333 items (over 1,200 pages, over 420,000 characters in total).
Many of these are summaries of examples where multiple lower timeframes are logically linked with higher timeframes using three RCI lines, ultimately interpreting the lower timeframes to wait for buy-the-dounce (pullback) or sell-the-rally timings (i.e., mBDSR signals).
Additionally,there are many that emphasize capturing points where multiple entry reasons overlap..
Furthermore,the method of exploring upside targets and downside targets using the three RCI linesis also included.
In the PDF explanations,over 1,200 chartsare used.
× ![]()


