

[Multiple Entry Bases] Support line (push-low) and moving averages and mBDSR (RCI two-filter) pullback buying signal
Indicator that shines when combined with RCI: BODSOR・mBDSR
Technique and Case Study (PDF) ★GogoJungle AWARD2020 Winner★
https://www.gogojungle.co.jp/tools/indicators/11836
Euro/NZD – EURNZD 4-hour chart
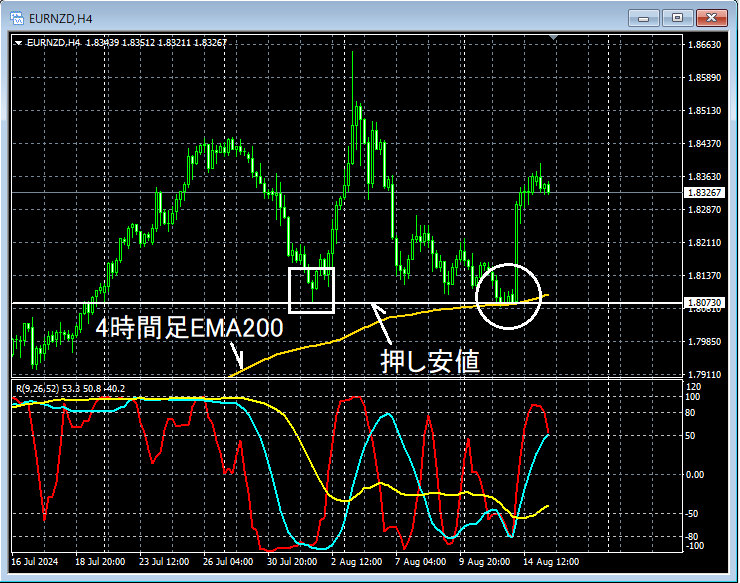
Looking at the area circled with a white circle on the 4-hour chart above, it seems to be a level of importance4-hour EMA200andSupport line (swing low)overlap, which could present a scenario where a dip-buy is not unreasonable. We will check for signs of upside initiation on lower timeframes.
Euro/NZD – EURNZD 1-hour chart
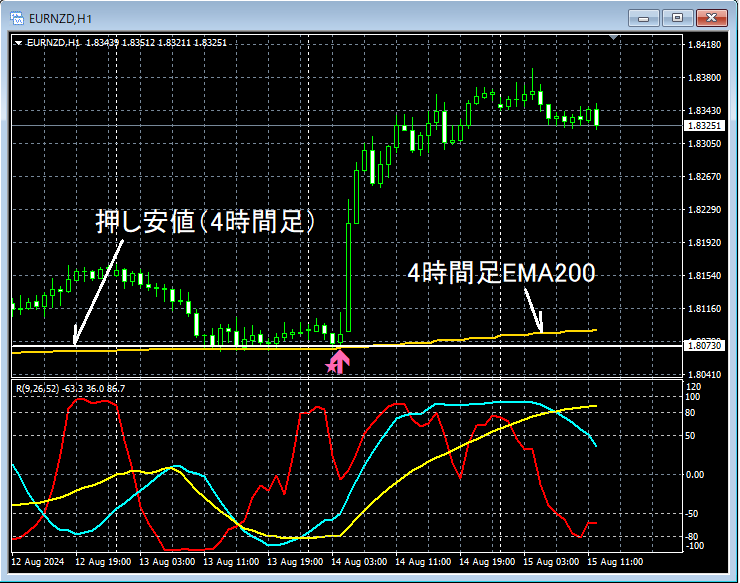
On the above 1-hour chart,4-hour EMA200andSupport line (4-hour swing low)overlap,mBDSR (2 RCI filters) dip-buy signallights up, and price rises sharply immediately after.
Down to the area close to the moving average that is considered importantandthe drop to the support lineandthe dip-buy signal from mBDSR (RCI2-filter) lights up— these are multiple entry justifications overlapping.
From this example,a trading method focusing on rebounds at moving averages and swing lows (Dow theory)andthe signals of mBDSRshow a strong compatibility.
Indicator that shines when combined with RCI: BODSOR・mBDSR
Technique and Case Study (PDF) ★GogoJungle AWARD2020 Winner★
https://www.gogojungle.co.jp/tools/indicators/11836
The PDF file contains 333 items (over 1,200 pages, over 420,000 characters in total).
Many of them are cases that culminate in an arrangement where multiple lower-timeframe conditions are examined logically by linking higher and lower timeframes using the RCI 3-line method, ultimately waiting for a dip-buy or pullback-sell timing on the lower timeframe (i.e., the mBDSR signal).
Additionally,many emphasize capturing points where multiple entry justifications converge.There are also many cases included.
Note thatthere are also methodologies that explore upward targets and downward targets using the RCI 3-line method..
In the PDF explanations,more than 1,200 chartsare used.

Technique and Case Study (PDF) ★GogoJungle AWARD2020 Winner★
https://www.gogojungle.co.jp/tools/indicators/11836
Euro/NZD – EURNZD 4-hour chart
Looking at the area circled with a white circle on the 4-hour chart above, it seems to be a level of importance4-hour EMA200andSupport line (swing low)overlap, which could present a scenario where a dip-buy is not unreasonable. We will check for signs of upside initiation on lower timeframes.
Euro/NZD – EURNZD 1-hour chart
On the above 1-hour chart,4-hour EMA200andSupport line (4-hour swing low)overlap,mBDSR (2 RCI filters) dip-buy signallights up, and price rises sharply immediately after.
Down to the area close to the moving average that is considered importantandthe drop to the support lineandthe dip-buy signal from mBDSR (RCI2-filter) lights up— these are multiple entry justifications overlapping.
From this example,a trading method focusing on rebounds at moving averages and swing lows (Dow theory)andthe signals of mBDSRshow a strong compatibility.
Indicator that shines when combined with RCI: BODSOR・mBDSR
Technique and Case Study (PDF) ★GogoJungle AWARD2020 Winner★
https://www.gogojungle.co.jp/tools/indicators/11836
The PDF file contains 333 items (over 1,200 pages, over 420,000 characters in total).
Many of them are cases that culminate in an arrangement where multiple lower-timeframe conditions are examined logically by linking higher and lower timeframes using the RCI 3-line method, ultimately waiting for a dip-buy or pullback-sell timing on the lower timeframe (i.e., the mBDSR signal).
Additionally,many emphasize capturing points where multiple entry justifications converge.There are also many cases included.
Note thatthere are also methodologies that explore upward targets and downward targets using the RCI 3-line method..
In the PDF explanations,more than 1,200 chartsare used.
× ![]()


