

[Gold攻略] Noticeable high prices on higher timeframe and the sign of mBDSR (RCI 2-line filter) from the chart of August 14, 2024
Indicator that captures the bottom/top reversal in combination with RCI【mBDSR】
Method and Case Studies (PDF) ★GogoJungle AWARD2020 winner★
https://www.gogojungle.co.jp/tools/indicators/11836
The above product includes 301 PDFs. For the list of the PDFs' titles and other details, please see the article below.
About the 301 PDF files included with 【BODSOR・mBDSR】
https://www.gogojungle.co.jp/finance/navi/articles/34271
Gold XAUUSD 1-hour chart
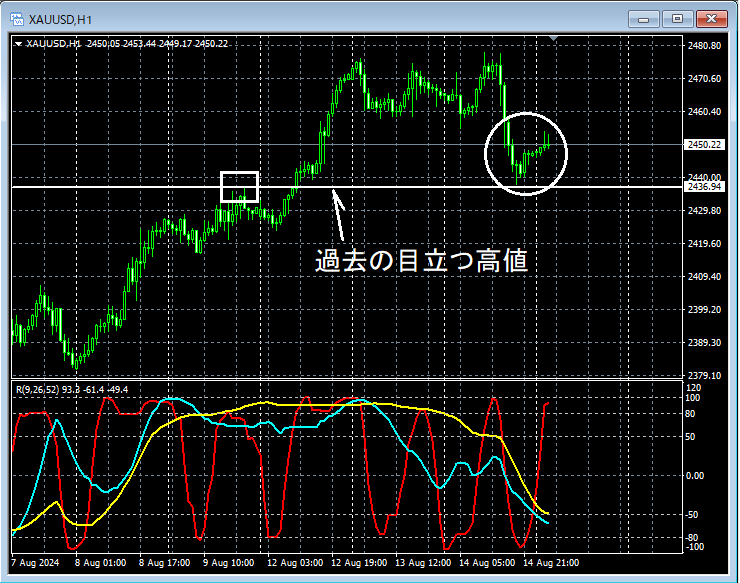
If you look at the area circled with a white circle on the 1-hour chart above,you can see that it has fallen to near past notable highsIt may not be strange to expect a slight rise. We will look for signs of a rebound on lower timeframes.
Gold XAUUSD 5-minute chart
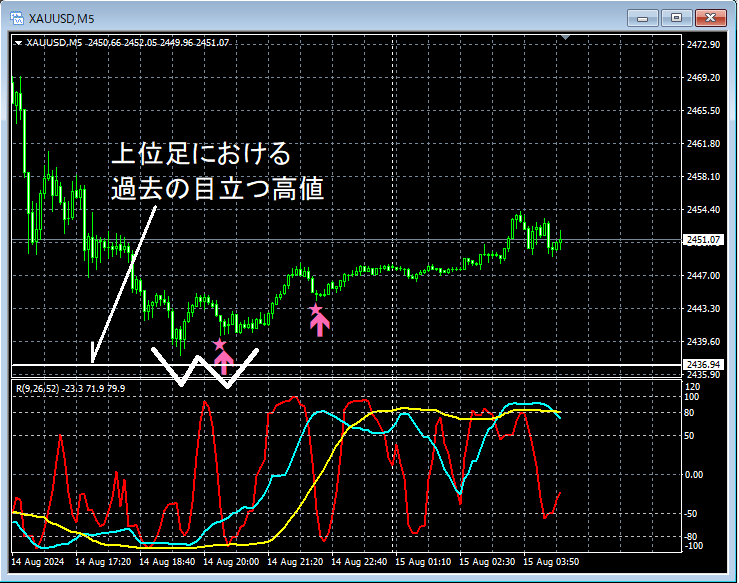
On the above 5-minute chart,near past notable highs on the higher timeframeit falls,forms a double bottomand rises. Thedouble bottomon the right side valley and the subsequent risemBDSR (RCI two-line filter) pullback buy signallights up at an opportune moment.
From this example,a trading method that focuses on past notable highs and double bottomsandthe signals of mBDSRshow high compatibility.
Also, for the initial pullback buy signal in particular, placing the stop loss just below the nearby low (the left-side valley of the double bottom)can lead to favorable risk-reward trades.
Indicator that shines in combination with RCI【BODSOR・mBDSR】
Method and Case Studies (PDF) ★GogoJungle AWARD2020 winner★
https://www.gogojungle.co.jp/tools/indicators/11836
PDF files include 301 items (over 1,000 pages, over 350,000 characters in total).
Most of them aresummaries of how to logically link higher and lower timeframes using the RCI three-line setup, examining multiple lower-timeframe conditions sequentially, and ultimately waiting for pullbacks or recoveries on the lower timeframe (i.e., mBDSR signals).
Also,many focus on identifying points where multiple entry rationale overlap..
The explanation usesover 1,000 charts.

Method and Case Studies (PDF) ★GogoJungle AWARD2020 winner★
https://www.gogojungle.co.jp/tools/indicators/11836
The above product includes 301 PDFs. For the list of the PDFs' titles and other details, please see the article below.
About the 301 PDF files included with 【BODSOR・mBDSR】
https://www.gogojungle.co.jp/finance/navi/articles/34271
Gold XAUUSD 1-hour chart
If you look at the area circled with a white circle on the 1-hour chart above,you can see that it has fallen to near past notable highsIt may not be strange to expect a slight rise. We will look for signs of a rebound on lower timeframes.
Gold XAUUSD 5-minute chart
On the above 5-minute chart,near past notable highs on the higher timeframeit falls,forms a double bottomand rises. Thedouble bottomon the right side valley and the subsequent risemBDSR (RCI two-line filter) pullback buy signallights up at an opportune moment.
From this example,a trading method that focuses on past notable highs and double bottomsandthe signals of mBDSRshow high compatibility.
Also, for the initial pullback buy signal in particular, placing the stop loss just below the nearby low (the left-side valley of the double bottom)can lead to favorable risk-reward trades.
Indicator that shines in combination with RCI【BODSOR・mBDSR】
Method and Case Studies (PDF) ★GogoJungle AWARD2020 winner★
https://www.gogojungle.co.jp/tools/indicators/11836
PDF files include 301 items (over 1,000 pages, over 350,000 characters in total).
Most of them aresummaries of how to logically link higher and lower timeframes using the RCI three-line setup, examining multiple lower-timeframe conditions sequentially, and ultimately waiting for pullbacks or recoveries on the lower timeframe (i.e., mBDSR signals).
Also,many focus on identifying points where multiple entry rationale overlap..
The explanation usesover 1,000 charts.
× ![]()


