

[Today's USD/JPY Strategy] Double Top and mBDSR (RCI 2-band filter) Sell Signal
The indicator “Taking Investors’ Bottoms and Reversals” in combination with RCI【mBDSR】
and method / case studies (PDF) ★GogoJungle AWARD2020 winner★
https://www.gogojungle.co.jp/tools/indicators/11836
The above product includes 301 PDFs. For a list of the PDF titles, please see the article below.
About the 301 PDF files included with “BODSOR・mBDSR”
https://www.gogojungle.co.jp/finance/navi/articles/34271
USD/JPY 1-hour chart
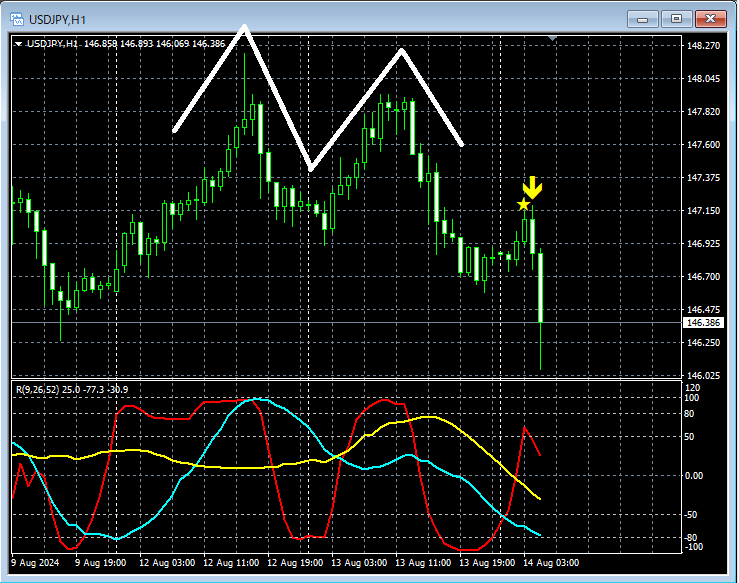
On the 1-hour chart above,a double topis formed and it is declining. In the middle,the return-sell signal of mBDSR (RCI two-filter)lights up, and it declines further.
From this example,a trading method focusing on double topsandthe signals of mBDSRshow high compatibility.
The indicator 【BODSOR・mBDSR】, which shows strength when combined with RCI
and method / case studies (PDF) ★GogoJungle AWARD2020 winner★
https://www.gogojungle.co.jp/tools/indicators/11836
The PDF files include 301 documents (over 1,000 pages, over 350,000 characters in total).
Many of them describe cases where upper and lower timeframes are logically linked using three RCI lines to examine multiple lower-timeframe conditions step by step, ultimately waiting for pullbacks or retracements on the lower timeframe (i.e., the mBDSR signals)..
In addition,there are many that emphasize catching points where multiple entry reasons overlap..
The explanations usemore than 1,000 charts.

and method / case studies (PDF) ★GogoJungle AWARD2020 winner★
https://www.gogojungle.co.jp/tools/indicators/11836
The above product includes 301 PDFs. For a list of the PDF titles, please see the article below.
About the 301 PDF files included with “BODSOR・mBDSR”
https://www.gogojungle.co.jp/finance/navi/articles/34271
USD/JPY 1-hour chart
On the 1-hour chart above,a double topis formed and it is declining. In the middle,the return-sell signal of mBDSR (RCI two-filter)lights up, and it declines further.
From this example,a trading method focusing on double topsandthe signals of mBDSRshow high compatibility.
The indicator 【BODSOR・mBDSR】, which shows strength when combined with RCI
and method / case studies (PDF) ★GogoJungle AWARD2020 winner★
https://www.gogojungle.co.jp/tools/indicators/11836
The PDF files include 301 documents (over 1,000 pages, over 350,000 characters in total).
Many of them describe cases where upper and lower timeframes are logically linked using three RCI lines to examine multiple lower-timeframe conditions step by step, ultimately waiting for pullbacks or retracements on the lower timeframe (i.e., the mBDSR signals)..
In addition,there are many that emphasize catching points where multiple entry reasons overlap..
The explanations usemore than 1,000 charts.
× ![]()


