

Double Top Neckline Return Sell and mBDSR (RCI 2-Period Filter) Signals
Indicator that captures the bottom and reversal with RCI: 【mBDSR】
Methods and Case Studies (PDF) ★GogoJungle AWARD2020 Winner★
https://www.gogojungle.co.jp/tools/indicators/11836
The above products include 301 PDFs. For a list of the PDF titles, please see the article below.
Regarding the 301 PDF files included with 【BODSOR・mBDSR】
https://www.gogojungle.co.jp/finance/navi/articles/34271
AUDJPY 15-minute chart
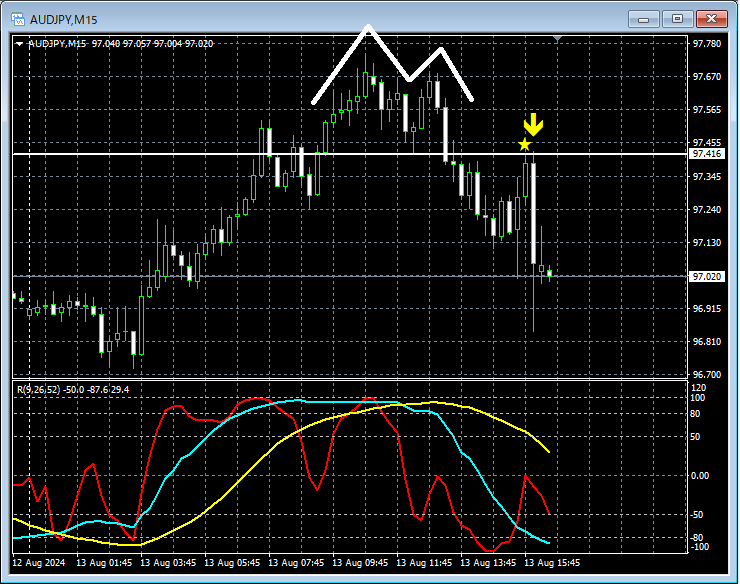
On the 15-minute chart above,the neck line of the double topwas broken to the downside, then rose back toward the neck line wherethe mBDSR (2 RCI filters) sell signallit up, and afterward the price declined firmly.
From this example,a trading method focusing on the neck line of the double topand thesignal from mBDSRshow a high degree of compatibility.
Indicator that shines in combination with RCI: 【BODSOR・mBDSR】
Methods and Case Studies (PDF) ★GogoJungle AWARD2020 Winner★
https://www.gogojungle.co.jp/tools/indicators/11836
The PDF files included amount to 301 (over 1,000 pages, over 350,000 characters in total).
Many of them are designed as examples that logically link higher and lower timeframes using three RCI lines, progressively examining multiple lower timeframes and ultimately waiting for pullbacks or rallies (i.e., mBDSR signals) on the lower timeframe.many focus on identifying points where multiple entry reasons overlap.In addition,
There are
A total of over 1,000 charts are used in the explanations.

Methods and Case Studies (PDF) ★GogoJungle AWARD2020 Winner★
https://www.gogojungle.co.jp/tools/indicators/11836
The above products include 301 PDFs. For a list of the PDF titles, please see the article below.
Regarding the 301 PDF files included with 【BODSOR・mBDSR】
https://www.gogojungle.co.jp/finance/navi/articles/34271
AUDJPY 15-minute chart
On the 15-minute chart above,the neck line of the double topwas broken to the downside, then rose back toward the neck line wherethe mBDSR (2 RCI filters) sell signallit up, and afterward the price declined firmly.
From this example,a trading method focusing on the neck line of the double topand thesignal from mBDSRshow a high degree of compatibility.
Indicator that shines in combination with RCI: 【BODSOR・mBDSR】
Methods and Case Studies (PDF) ★GogoJungle AWARD2020 Winner★
https://www.gogojungle.co.jp/tools/indicators/11836
The PDF files included amount to 301 (over 1,000 pages, over 350,000 characters in total).
Many of them are designed as examples that logically link higher and lower timeframes using three RCI lines, progressively examining multiple lower timeframes and ultimately waiting for pullbacks or rallies (i.e., mBDSR signals) on the lower timeframe.many focus on identifying points where multiple entry reasons overlap.In addition,
There are
A total of over 1,000 charts are used in the explanations.
× ![]()


