

[Multiple-entry basis] Counter-trend line and mBDSR (RCI two-band filter) selling signal
An indicator that shows its power when combined with RCI: BODSOR・mBDSR
Methods and Case Studies (PDF) ★GogoJungle AWARD2020 Winner★
https://www.gogojungle.co.jp/tools/indicators/11836
Euro New Zealand - EUR/NZD 15-minute chart
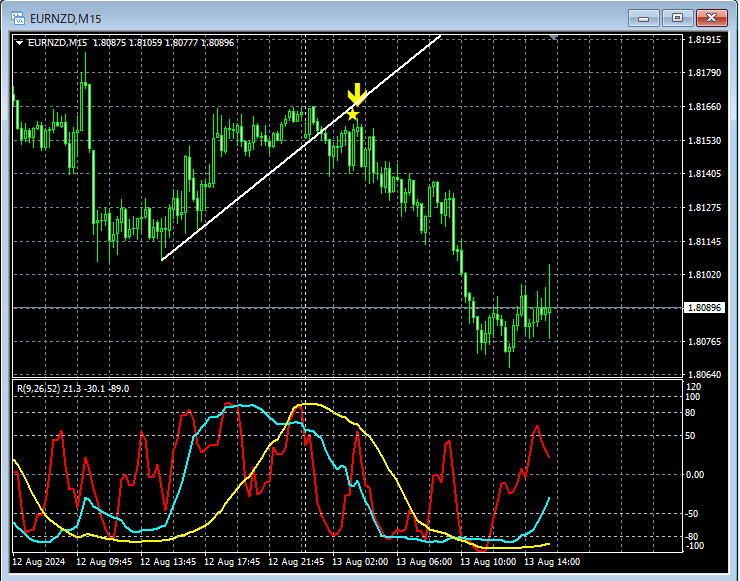
Details about the higher timeframe are omitted. In the above 15-minute chart,Counter-trend lineafter breaking below and then rising,mBDSR (Two RCI filters) sell signallights up and price tends to fall—a common pattern.
Break below the counter-trend lineandthe mBDSR sell signal lights upoverlapping multiple entry reasons can be observed.
From this example,the trading approach focused on the counter-trend lineandthe signal of mBDSRshow a high level of compatibility.
An indicator that shows its power when combined with RCI: BODSOR・mBDSR
Methods and Case Studies (PDF) ★GogoJungle AWARD2020 Winner★
https://www.gogojungle.co.jp/tools/indicators/11836
The PDF file includes 328 items (over 1,200 pages, over 410,000 characters in total).
Many of them are summaries of cases where multiple underlyings are examined by logically linking the higher and lower timeframes using three RCI lines, finally waiting for entry timing (i.e., mBDSR signals) on the lower timeframe for a buy-the-dottom or sell-the-retrace situation.This means they are descriptions of examples that have been distilled to the point of waiting for lower-timeframe signals after linking higher- and lower-timeframe circumstances.
Also,many focus on capturing points where multiple entry reasons coincide.There are also many that emphasize this approach.
In addition,there are methods that use the three-RCI-line to explore targets for upside and downside.They are included.
In the descriptions within the PDF file,more than 1,200 chartsare used.

Methods and Case Studies (PDF) ★GogoJungle AWARD2020 Winner★
https://www.gogojungle.co.jp/tools/indicators/11836
Euro New Zealand - EUR/NZD 15-minute chart
Details about the higher timeframe are omitted. In the above 15-minute chart,Counter-trend lineafter breaking below and then rising,mBDSR (Two RCI filters) sell signallights up and price tends to fall—a common pattern.
Break below the counter-trend lineandthe mBDSR sell signal lights upoverlapping multiple entry reasons can be observed.
From this example,the trading approach focused on the counter-trend lineandthe signal of mBDSRshow a high level of compatibility.
An indicator that shows its power when combined with RCI: BODSOR・mBDSR
Methods and Case Studies (PDF) ★GogoJungle AWARD2020 Winner★
https://www.gogojungle.co.jp/tools/indicators/11836
The PDF file includes 328 items (over 1,200 pages, over 410,000 characters in total).
Many of them are summaries of cases where multiple underlyings are examined by logically linking the higher and lower timeframes using three RCI lines, finally waiting for entry timing (i.e., mBDSR signals) on the lower timeframe for a buy-the-dottom or sell-the-retrace situation.This means they are descriptions of examples that have been distilled to the point of waiting for lower-timeframe signals after linking higher- and lower-timeframe circumstances.
Also,many focus on capturing points where multiple entry reasons coincide.There are also many that emphasize this approach.
In addition,there are methods that use the three-RCI-line to explore targets for upside and downside.They are included.
In the descriptions within the PDF file,more than 1,200 chartsare used.
× ![]()


