

[Multiple entry evidence] Counter-trend line and mBDSR pullback buy signal
Indicator that demonstrates power when used in combination with RCI【BODSOR・mBDSR】
Methodology and case studies (PDF) ★GogoJungle AWARD2020 Winner★
https://www.gogojungle.co.jp/tools/indicators/11836
The above product includes 327 PDFs. For a list of those PDFs’ titles and other details, please refer to the article below.
About the 327 PDF files included with 【BODSOR・mBDSR】
https://www.gogojungle.co.jp/finance/navi/articles/34271
Pound/Australia GBP AUD 5-minute chart
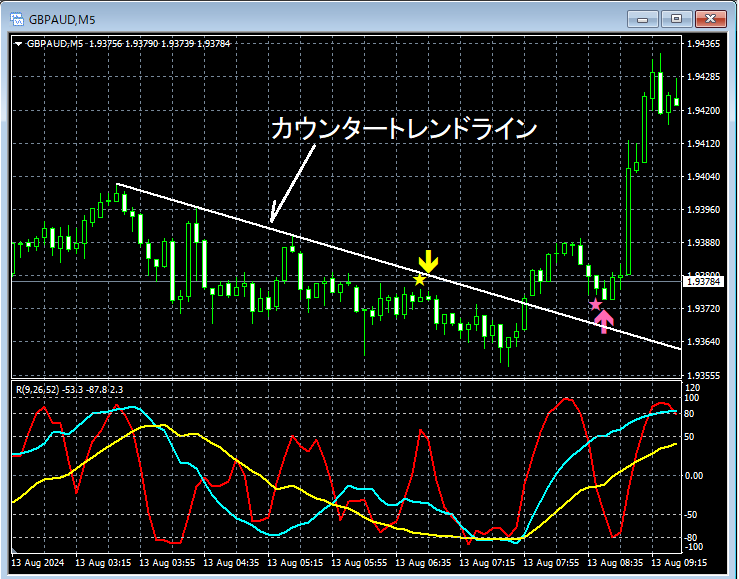
The status of the higher timeframe is omitted. On the upper 5-minute chart,Counter-trend lineafter breaking above, on the pullback,mBDSR (two RCI filters) pullback buying signallights up and price rises, a common pattern.
Break above the counter-trend lineandmBDSR pullback buying signal lighting upare overlapping as multiple entry justification.
From this example,the trading method focusing on the counter-trend lineandthe signals of mBDSRappear to be highly compatible.
Indicator that demonstrates power when used in combination with RCI【BODSOR・mBDSR】
Methodology and case studies (PDF) ★GogoJungle AWARD2020 Winner★
https://www.gogojungle.co.jp/tools/indicators/11836
The PDF files include 327 items (over 1,200 pages, over 400,000 characters in total).
Many of them are focused on logically linking upper and lower timeframes using three RCI lines to examine the status of multiple lower timeframes, ultimately waiting for pullbacks or reversals on the lower timeframe (i.e., the signals of mBDSR).This has been summarized in the examples.
Additionally,many are focused on capturing points where multiple entry signals align.There are also many that explore ascent and decline targets using three RCI lines.
Furthermore,the method of exploring upside and downside targets using three RCI linesis included.
In the PDF explanations,over 1,200 chartsare used.

Methodology and case studies (PDF) ★GogoJungle AWARD2020 Winner★
https://www.gogojungle.co.jp/tools/indicators/11836
The above product includes 327 PDFs. For a list of those PDFs’ titles and other details, please refer to the article below.
About the 327 PDF files included with 【BODSOR・mBDSR】
https://www.gogojungle.co.jp/finance/navi/articles/34271
Pound/Australia GBP AUD 5-minute chart
The status of the higher timeframe is omitted. On the upper 5-minute chart,Counter-trend lineafter breaking above, on the pullback,mBDSR (two RCI filters) pullback buying signallights up and price rises, a common pattern.
Break above the counter-trend lineandmBDSR pullback buying signal lighting upare overlapping as multiple entry justification.
From this example,the trading method focusing on the counter-trend lineandthe signals of mBDSRappear to be highly compatible.
Indicator that demonstrates power when used in combination with RCI【BODSOR・mBDSR】
Methodology and case studies (PDF) ★GogoJungle AWARD2020 Winner★
https://www.gogojungle.co.jp/tools/indicators/11836
The PDF files include 327 items (over 1,200 pages, over 400,000 characters in total).
Many of them are focused on logically linking upper and lower timeframes using three RCI lines to examine the status of multiple lower timeframes, ultimately waiting for pullbacks or reversals on the lower timeframe (i.e., the signals of mBDSR).This has been summarized in the examples.
Additionally,many are focused on capturing points where multiple entry signals align.There are also many that explore ascent and decline targets using three RCI lines.
Furthermore,the method of exploring upside and downside targets using three RCI linesis included.
In the PDF explanations,over 1,200 chartsare used.
× ![]()


