

Moving average line, counter-trend line, and mBDSR (RCI two-filter) buy signal
Indicator that shines when combined with RCI: BODSOR and mBDSR
Methods and Case Studies (PDF) ★GogoJungle AWARD 2020 winner★
https://www.gogojungle.co.jp/tools/indicators/11836
Kiwi Dollar NZDUSD 15-minute Chart
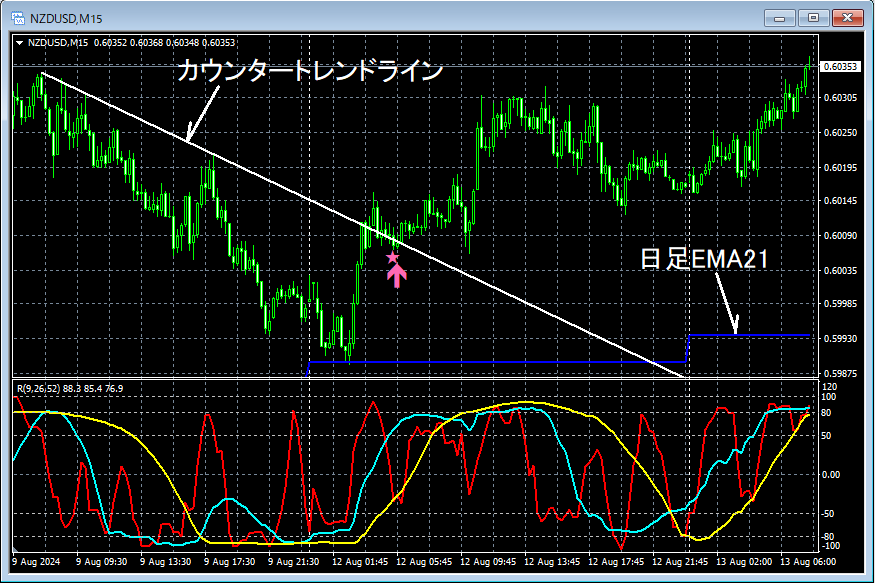
Regarding the higher timeframe, omitted. In the 15-minute chart aboveDaily EMA21rebound aroundCounter-trend lineand then drop below itmBDSR (Filter: RCI26 and RCI52) Buy-the-dip signallights up and rises.
From this example,a trading method that focuses on moving averages and counter-trend linesandthe compatibility with mBDSR signalsappears to be high.
Indicator that shines when combined with RCI: BODSOR and mBDSR
Methods and Case Studies (PDF) ★GogoJungle AWARD 2020 winner★
https://www.gogojungle.co.jp/tools/indicators/11836
The PDF file includes 320 items (over 1,000 pages, over 350,000 characters in total).
Many of them are summaries of cases where, by logically linking the higher and lower timeframes using three RCI lines, multiple lower-timeframe situations are considered sequentially, and finally waiting for the timing of a dip-buy or rebound-sell on the lower timeframe (i.e., the mBDSR signal).
Additionally,many emphasize identifying points where multiple entry reasons align.There are also many cases included.
Furthermore,there are methods that explore upside and downside targets using the three RCI lines.Also included.
In the PDF explanations,over 1,000 chartsare used.

Methods and Case Studies (PDF) ★GogoJungle AWARD 2020 winner★
https://www.gogojungle.co.jp/tools/indicators/11836
Kiwi Dollar NZDUSD 15-minute Chart
Regarding the higher timeframe, omitted. In the 15-minute chart aboveDaily EMA21rebound aroundCounter-trend lineand then drop below itmBDSR (Filter: RCI26 and RCI52) Buy-the-dip signallights up and rises.
From this example,a trading method that focuses on moving averages and counter-trend linesandthe compatibility with mBDSR signalsappears to be high.
Indicator that shines when combined with RCI: BODSOR and mBDSR
Methods and Case Studies (PDF) ★GogoJungle AWARD 2020 winner★
https://www.gogojungle.co.jp/tools/indicators/11836
The PDF file includes 320 items (over 1,000 pages, over 350,000 characters in total).
Many of them are summaries of cases where, by logically linking the higher and lower timeframes using three RCI lines, multiple lower-timeframe situations are considered sequentially, and finally waiting for the timing of a dip-buy or rebound-sell on the lower timeframe (i.e., the mBDSR signal).
Additionally,many emphasize identifying points where multiple entry reasons align.There are also many cases included.
Furthermore,there are methods that explore upside and downside targets using the three RCI lines.Also included.
In the PDF explanations,over 1,000 chartsare used.
× ![]()


