

Pin Bar (candlestick with a long upper wick) and the lower-timeframe mBDSR (RCI two-line filter) sell signal
0
Indicator that demonstrates power when combined with RCI【BODSOR・mBDSR】
Method and Case Study (PDF) ★GogoJungle AWARD2020 Winner★
https://www.gogojungle.co.jp/tools/indicators/11836
Pound/Australian Dollar GBP/AUD 4-hour chart
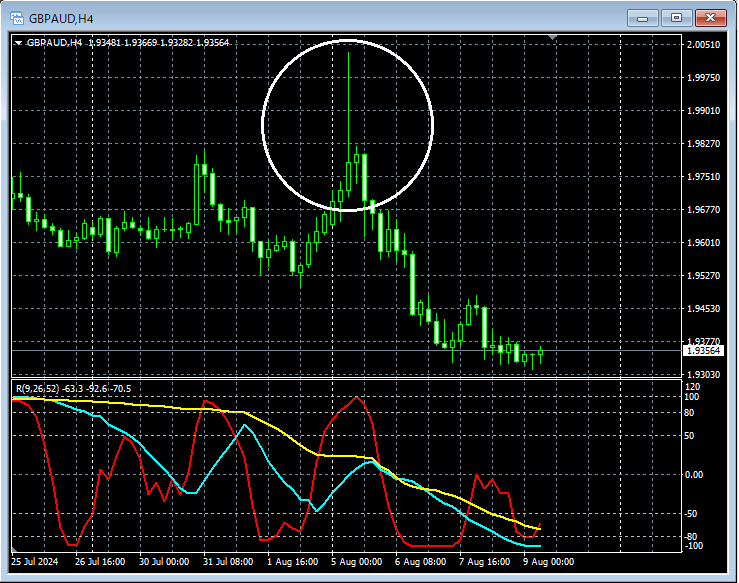
If you look at the area circled by the white circle on the 4-hour chart above, it suggests a declinePin Bar (candlestick with a long upper wick)appears. It may be a scene where it is not strange to consider selling on a retracement on lower timeframes.
Pound/Australian Dollar GBP/AUD 30-minute chart
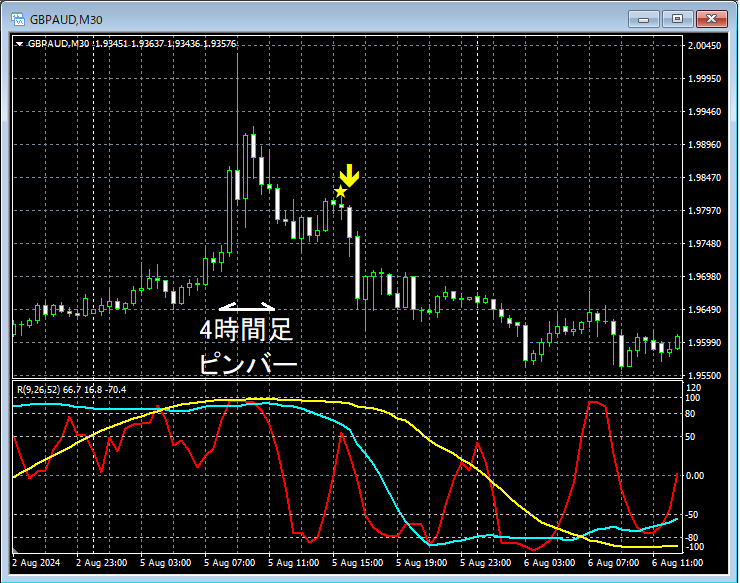
On the 30-minute chart above, in the context of the 4-hour chartPin Bar (candlestick with a long upper wick)appearance is followed by a decline,mBDSR (Filter: RCI26 and RCI52) sell signallights up and the price continues to drop firmly.
From this example,a trading method focusing on Pin Bar (candlestick with a long upper wick)andthe signals of mBDSRshow high compatibility.
Indicator that demonstrates power when combined with RCI【BODSOR・mBDSR】
Method and Case Study (PDF) ★GogoJungle AWARD2020 Winner★
https://www.gogojungle.co.jp/tools/indicators/11836
The PDF file includes 320 items (over 1,000 pages, over 350,000 characters in total).
Many of these are organized around examining multiple lower-timeframe situations by logically linking upper and lower timeframes using three RCI lines, ultimately waiting for a timing to buy on dips or sell on rallies on the lower timeframes (i.e., signals from mBDSR).It also emphasizes capturing points where multiple entry bases align.
Additionally, it includes a method for exploring bullish and bearish targets using the three RCI lines.
In the PDF explanations,over 1,000 chartsare used.

Method and Case Study (PDF) ★GogoJungle AWARD2020 Winner★
https://www.gogojungle.co.jp/tools/indicators/11836
Pound/Australian Dollar GBP/AUD 4-hour chart
If you look at the area circled by the white circle on the 4-hour chart above, it suggests a declinePin Bar (candlestick with a long upper wick)appears. It may be a scene where it is not strange to consider selling on a retracement on lower timeframes.
Pound/Australian Dollar GBP/AUD 30-minute chart
On the 30-minute chart above, in the context of the 4-hour chartPin Bar (candlestick with a long upper wick)appearance is followed by a decline,mBDSR (Filter: RCI26 and RCI52) sell signallights up and the price continues to drop firmly.
From this example,a trading method focusing on Pin Bar (candlestick with a long upper wick)andthe signals of mBDSRshow high compatibility.
Indicator that demonstrates power when combined with RCI【BODSOR・mBDSR】
Method and Case Study (PDF) ★GogoJungle AWARD2020 Winner★
https://www.gogojungle.co.jp/tools/indicators/11836
The PDF file includes 320 items (over 1,000 pages, over 350,000 characters in total).
Many of these are organized around examining multiple lower-timeframe situations by logically linking upper and lower timeframes using three RCI lines, ultimately waiting for a timing to buy on dips or sell on rallies on the lower timeframes (i.e., signals from mBDSR).It also emphasizes capturing points where multiple entry bases align.
Additionally, it includes a method for exploring bullish and bearish targets using the three RCI lines.
In the PDF explanations,over 1,000 chartsare used.
× ![]()


