

Reversal of resistance support and mBDSR (RCI2 one-filter) buy signal
Indicator that shines in combination with RCI: BODSOR・mBDSR
Methods and Case Studies (PDF) ★GogoJungle AWARD2020 Winner★
https://www.gogojungle.co.jp/tools/indicators/11836
CADCHF 30-minute chart
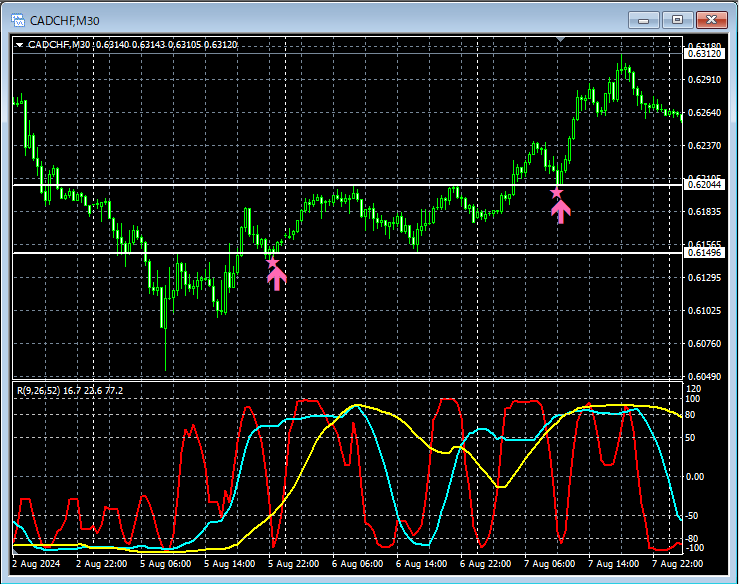
On the 30-minute chart above,Resistance/Support Turnaroundduring an upward move,mBDSR (2-line RCI filter) pullback buy signallights up in a timely manner.
From this example,a trading method focusing on resistance/support turnaroundsandthe signals of mBDSRshow high compatibility.
Indicator that shines in combination with RCI: BODSOR・mBDSR
Methods and Case Studies (PDF) ★GogoJungle AWARD2020 Winner★
https://www.gogojungle.co.jp/tools/indicators/11836
The PDF file includes 320 items (over 1,000 pages, over 350,000 characters in total).
Most of them are organized as examples showing how three RCI lines logically link higher and lower timeframes to examine multiple lower-timeframe conditions sequentially, ultimately waiting for pullbacks in the lower timeframes or reversals (i.e., mBDSR signals).
Additionally,many of them emphasize identifying points where multiple entry justifications coincide.There are many of those.
Note thatthere are also methods that explore upside/downside targets using three-line RCI.Additionally included.
In the PDF explanations,more than 1,000 chartsare used.

Methods and Case Studies (PDF) ★GogoJungle AWARD2020 Winner★
https://www.gogojungle.co.jp/tools/indicators/11836
CADCHF 30-minute chart
On the 30-minute chart above,Resistance/Support Turnaroundduring an upward move,mBDSR (2-line RCI filter) pullback buy signallights up in a timely manner.
From this example,a trading method focusing on resistance/support turnaroundsandthe signals of mBDSRshow high compatibility.
Indicator that shines in combination with RCI: BODSOR・mBDSR
Methods and Case Studies (PDF) ★GogoJungle AWARD2020 Winner★
https://www.gogojungle.co.jp/tools/indicators/11836
The PDF file includes 320 items (over 1,000 pages, over 350,000 characters in total).
Most of them are organized as examples showing how three RCI lines logically link higher and lower timeframes to examine multiple lower-timeframe conditions sequentially, ultimately waiting for pullbacks in the lower timeframes or reversals (i.e., mBDSR signals).
Additionally,many of them emphasize identifying points where multiple entry justifications coincide.There are many of those.
Note thatthere are also methods that explore upside/downside targets using three-line RCI.Additionally included.
In the PDF explanations,more than 1,000 chartsare used.
× ![]()


