

From yesterday's USD/JPY chart (August 10, 2024) – the signal of the previous high and mBDSR (RCI with 2 lines filter) –
Indicator that captures “tops/bottoms and reversals” in combination with RCI: 【mBDSR】
Methods & Case Studies (PDF) ★GogoJungle AWARD2020 Winner★
https://www.gogojungle.co.jp/tools/indicators/11836
The above products include 301 PDFs. For a list of the PDF titles, please refer to the article below.
About the 301 PDF files included with 【BODSOR・mBDSR】
https://www.gogojungle.co.jp/finance/navi/articles/34271
USD/JPY 60-minute
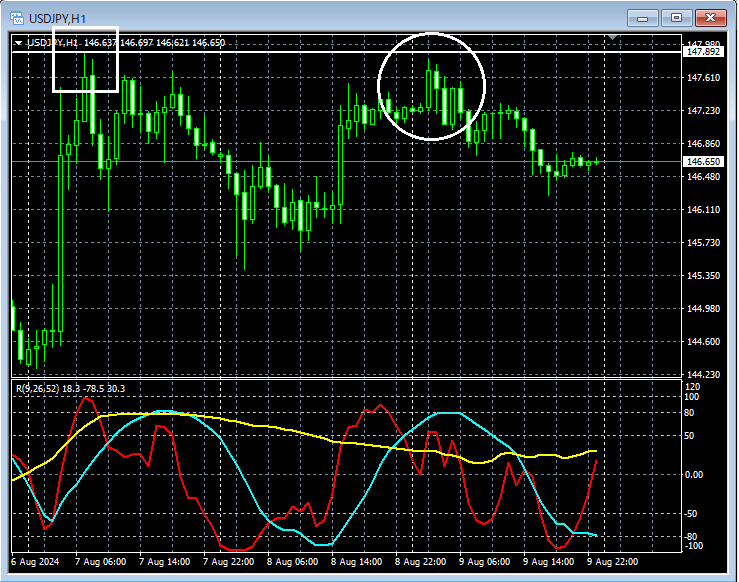
Looking at the area circled in white on the daily chart above,the previous highappears to be approached by a rise. It wouldn’t be surprising to see a slight pullback. We will look for signs of reversal on lower timeframes.
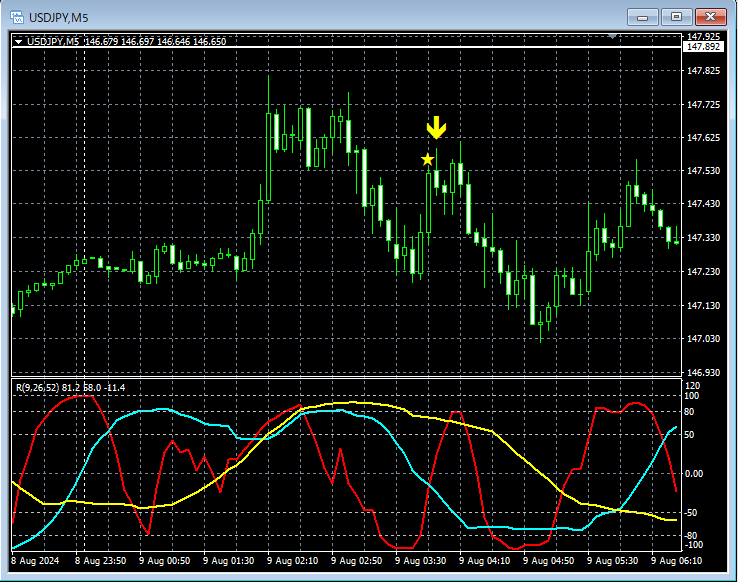
USD/JPY 5-minute
USD/JPY 15-minute
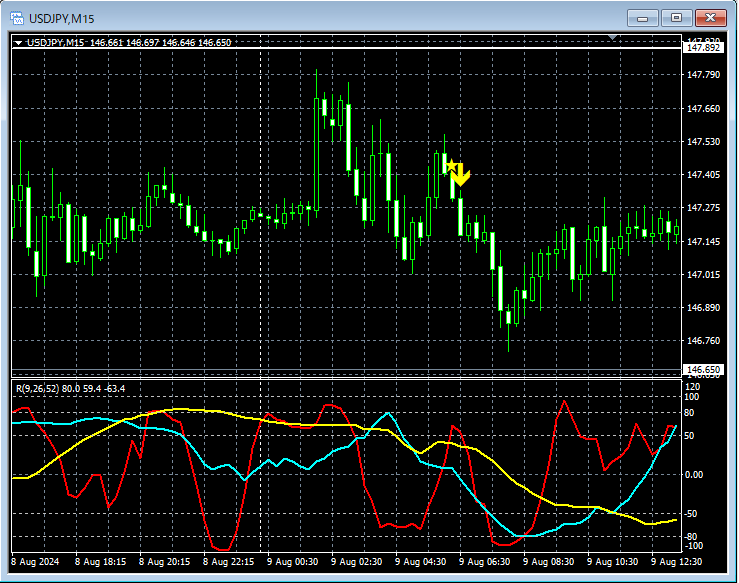
Previous high on the 1-hour chartfrom the vicinity, there is a tendency to reverse. On the upper 5-minute and 15-minute charts,the mBDSR (two RCI filters) sell-rebound signallights up, and subsequently the price declines.
From this example,a trading method that focuses on reversals from the previous highandthe signal of mBDSRshow strong compatibility.
Indicator that shines in combination with RCI: 【BODSOR・mBDSR】
Methods & Case Studies (PDF) ★GogoJungle AWARD2020 Winner★
https://www.gogojungle.co.jp/tools/indicators/11836
The PDF files include 301 documents (over 1,000 pages, over 350,000 characters in total).
Most of them demonstrate how to logically link higher and lower timeframes using the RCI triple-line, and progressively analyze multiple lower-timeframe situations, ultimately waiting for pullbacks in the lower timeframe (i.e., the mBDSR signals) to trigger entries.In addition,
many focus on identifying points where multiple entry justifications overlapas well.
The explanations involvemore than 1,000 chartsare used.

Methods & Case Studies (PDF) ★GogoJungle AWARD2020 Winner★
https://www.gogojungle.co.jp/tools/indicators/11836
The above products include 301 PDFs. For a list of the PDF titles, please refer to the article below.
About the 301 PDF files included with 【BODSOR・mBDSR】
https://www.gogojungle.co.jp/finance/navi/articles/34271
USD/JPY 60-minute
Looking at the area circled in white on the daily chart above,the previous highappears to be approached by a rise. It wouldn’t be surprising to see a slight pullback. We will look for signs of reversal on lower timeframes.
USD/JPY 5-minute
USD/JPY 15-minute
Previous high on the 1-hour chartfrom the vicinity, there is a tendency to reverse. On the upper 5-minute and 15-minute charts,the mBDSR (two RCI filters) sell-rebound signallights up, and subsequently the price declines.
From this example,a trading method that focuses on reversals from the previous highandthe signal of mBDSRshow strong compatibility.
Indicator that shines in combination with RCI: 【BODSOR・mBDSR】
Methods & Case Studies (PDF) ★GogoJungle AWARD2020 Winner★
https://www.gogojungle.co.jp/tools/indicators/11836
The PDF files include 301 documents (over 1,000 pages, over 350,000 characters in total).
Most of them demonstrate how to logically link higher and lower timeframes using the RCI triple-line, and progressively analyze multiple lower-timeframe situations, ultimately waiting for pullbacks in the lower timeframe (i.e., the mBDSR signals) to trigger entries.In addition,
many focus on identifying points where multiple entry justifications overlapas well.
The explanations involvemore than 1,000 chartsare used.
× ![]()


