

US Non-Farm Payrolls (NFP) and USD/JPY August 2, 2024
Indicator 【mBDSR】 that captures "tops/bottoms and reversals" in combination with RCI
Methods and case studies (PDF) ★GogoJungle AWARD2020 winner★
https://www.gogojungle.co.jp/tools/indicators/11836
The above products include 301 PDFs. For a list of the titles of those PDFs, please see the article below.
About the 301 PDF files included with 【BODSOR・mBDSR】
https://www.gogojungle.co.jp/finance/navi/articles/34271
USD/JPY 5-minute chart
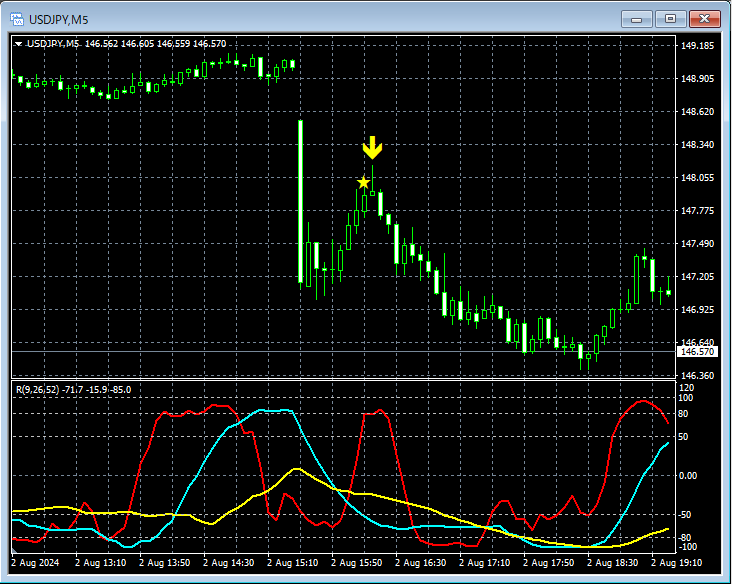
In the 5-minute chart above,after the release of the U.S. Employment Reporta large drop followed by a rebound,the return-sell signal of mBDSR (2 RCI lines filter)lights up, then the price resumes its decline.
Indicator 【BODSOR・mBDSR】 that showcases power when combined with RCI
Methods and case studies (PDF) ★GogoJungle AWARD2020 winner★
https://www.gogojungle.co.jp/tools/indicators/11836
301 PDFs are included (over 1,000 pages, over 350,000 characters in total).
Many of them are structured as follows:Each analysis links multiple higher- and lower-timeframe conditions using three RCI lines to logically connect the higher and lower timeframes, ultimately detailing the lower timeframe’s timing for buying on dips or selling on rallies (i.e., the signals of mBDSR).This is how they are organized.
Additionally,many emphasize identifying points where multiple entry reasons converge.There are many such examples.
In the explanations,more than 1,000 chartsare used.

Methods and case studies (PDF) ★GogoJungle AWARD2020 winner★
https://www.gogojungle.co.jp/tools/indicators/11836
The above products include 301 PDFs. For a list of the titles of those PDFs, please see the article below.
About the 301 PDF files included with 【BODSOR・mBDSR】
https://www.gogojungle.co.jp/finance/navi/articles/34271
USD/JPY 5-minute chart
In the 5-minute chart above,after the release of the U.S. Employment Reporta large drop followed by a rebound,the return-sell signal of mBDSR (2 RCI lines filter)lights up, then the price resumes its decline.
Indicator 【BODSOR・mBDSR】 that showcases power when combined with RCI
Methods and case studies (PDF) ★GogoJungle AWARD2020 winner★
https://www.gogojungle.co.jp/tools/indicators/11836
301 PDFs are included (over 1,000 pages, over 350,000 characters in total).
Many of them are structured as follows:Each analysis links multiple higher- and lower-timeframe conditions using three RCI lines to logically connect the higher and lower timeframes, ultimately detailing the lower timeframe’s timing for buying on dips or selling on rallies (i.e., the signals of mBDSR).This is how they are organized.
Additionally,many emphasize identifying points where multiple entry reasons converge.There are many such examples.
In the explanations,more than 1,000 chartsare used.
× ![]()


