

Prominent high price on the higher timeframe and the signal of mBDSR (RCI two-filter)
0
Indicator that shows power when combined with RCI: BODSOR・mBDSR
Methods and Case Studies (PDF) ★GogoJungle AWARD2020 win★
https://www.gogojungle.co.jp/tools/indicators/11836
USD/CAD Daily
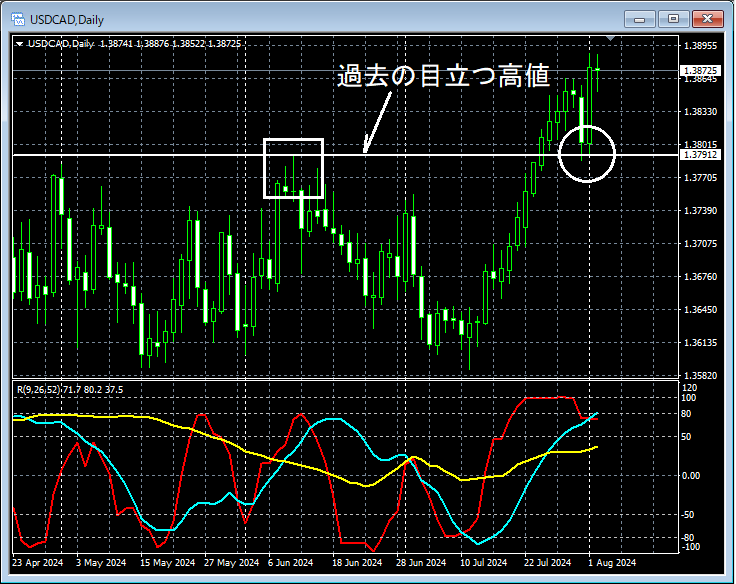
Looking at the area circled in white on the previous daily chart,you can see that it has moved down close to a notable past highnear that level. It might not be strange to consider a slight rise. We will look for signs of reversal on lower timeframes.
USD/CAD 15-minute chart
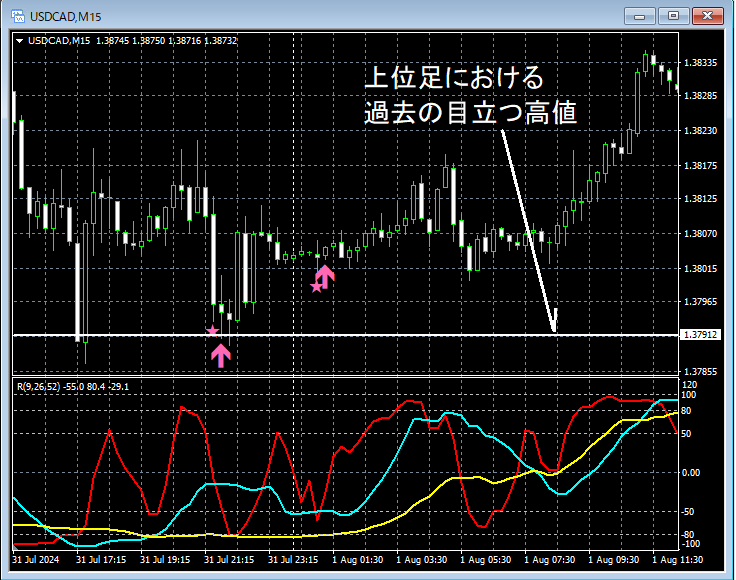
On the 15-minute chart above,after falling toward a notable past high on the higher timeframenear that area,mBDSR (RCI 2-band filter) pullback buy signallights up, and price subsequently rises firmly.
From this example,there is a strong compatibility between a trade method that focuses on past notable highsandthe mBDSR signals.
Indicator that shines when combined with RCI: BODSOR・mBDSR
Methods and Case Studies (PDF) ★GogoJungle AWARD2020 win★
https://www.gogojungle.co.jp/tools/indicators/11836
The PDF file includes 320 items (over 1,000 pages, over 350,000 characters in total).
Many of them are summarized as examples where, by logically linking the higher and lower timeframes using three RCI lines, multiple lower-timeframe conditions are examined sequentially, ultimately waiting for pullback buys or price recoveries on the lower timeframes (i.e., the signals of mBDSR).
Additionally,there are many that emphasize identifying points where multiple entry reasons overlap.Also included is a method for exploring ascent and descent targets using the three-RCI-line approach.
In the PDF explanations,
more than 1,000 chartsare used.

Methods and Case Studies (PDF) ★GogoJungle AWARD2020 win★
https://www.gogojungle.co.jp/tools/indicators/11836
USD/CAD Daily
Looking at the area circled in white on the previous daily chart,you can see that it has moved down close to a notable past highnear that level. It might not be strange to consider a slight rise. We will look for signs of reversal on lower timeframes.
USD/CAD 15-minute chart
On the 15-minute chart above,after falling toward a notable past high on the higher timeframenear that area,mBDSR (RCI 2-band filter) pullback buy signallights up, and price subsequently rises firmly.
From this example,there is a strong compatibility between a trade method that focuses on past notable highsandthe mBDSR signals.
Indicator that shines when combined with RCI: BODSOR・mBDSR
Methods and Case Studies (PDF) ★GogoJungle AWARD2020 win★
https://www.gogojungle.co.jp/tools/indicators/11836
The PDF file includes 320 items (over 1,000 pages, over 350,000 characters in total).
Many of them are summarized as examples where, by logically linking the higher and lower timeframes using three RCI lines, multiple lower-timeframe conditions are examined sequentially, ultimately waiting for pullback buys or price recoveries on the lower timeframes (i.e., the signals of mBDSR).
Additionally,there are many that emphasize identifying points where multiple entry reasons overlap.Also included is a method for exploring ascent and descent targets using the three-RCI-line approach.
In the PDF explanations,
more than 1,000 chartsare used.
× ![]()


