

Upper neckline on higher timeframes and pullback buy signal of mBDSR (RCI2 two-filter)
An indicator that shines when combined with RCI: BODSOR・mBDSR
Methods and Case Studies (PDF) ★GogoJungle AWARD 2020 Winner★
https://www.gogojungle.co.jp/tools/indicators/11836
GBP/USD 4-hour chart
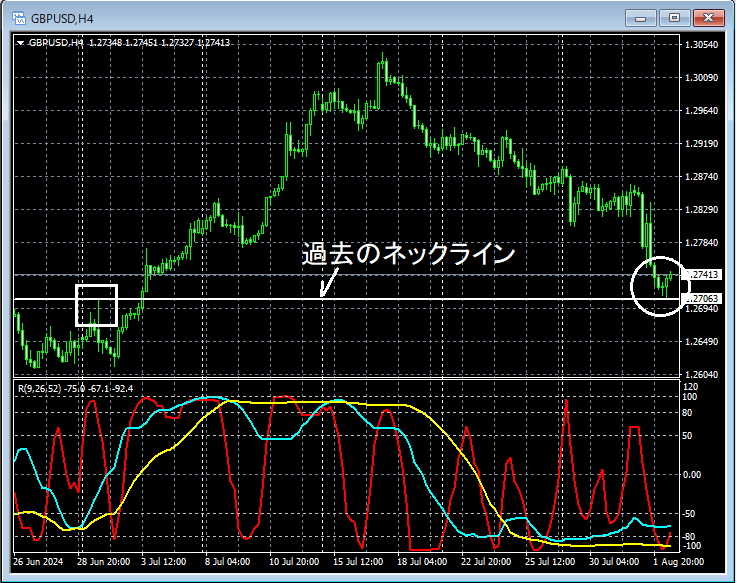
Looking at the area enclosed by the white circle on the 4-hour chart above,you can see that it has dropped near the previous necklinenearby. It isn’t surprising to consider a potential rebound. We will look for signs of a rebound on lower timeframes.
GBP/USD 1-minute chart
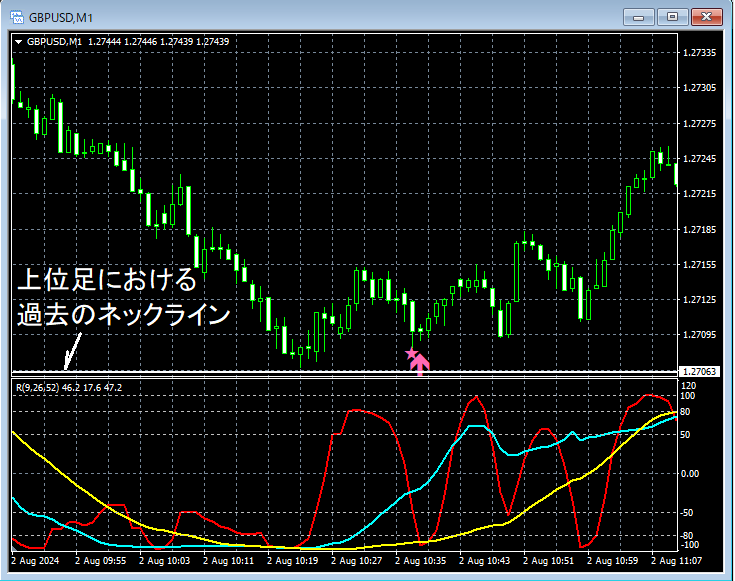
On the 1-minute chart above,near the past necklines on higher timeframesit dips and then shows a rebound tendency.mBDSR (two RCI lines filter) pullback buy signallights up, and price subsequently rises firmly.
From this example,a trading method that focuses on notable past highsand thesignals of mBDSRshow strong compatibility.
Also in this example, by placing the stop loss just slightly below the most recent low,a trade with favorable risk-rewardis achievable.
An indicator that shines when combined with RCI: BODSOR・mBDSR
Methods and Case Studies (PDF) ★GogoJungle AWARD 2020 Winner★
https://www.gogojungle.co.jp/tools/indicators/11836
The PDF file includes 320 items (over 1,000 pages, over 350,000 words in total).
Many of them areexamples that use three RCI lines to logically link higher and lower timeframes, sequentially analyze the status of multiple lower timeframes, and finally wait for pullbacks or rebounds on the lower timeframe (i.e., the mBDSR signal)..
Additionally,many focus on identifying points where multiple entry reasons overlap..
Furthermore,it also includes methods for exploring upward and downward targets using three RCI lines..
In the PDF explanations,over 1,000 chartsare used.

Methods and Case Studies (PDF) ★GogoJungle AWARD 2020 Winner★
https://www.gogojungle.co.jp/tools/indicators/11836
GBP/USD 4-hour chart
Looking at the area enclosed by the white circle on the 4-hour chart above,you can see that it has dropped near the previous necklinenearby. It isn’t surprising to consider a potential rebound. We will look for signs of a rebound on lower timeframes.
GBP/USD 1-minute chart
On the 1-minute chart above,near the past necklines on higher timeframesit dips and then shows a rebound tendency.mBDSR (two RCI lines filter) pullback buy signallights up, and price subsequently rises firmly.
From this example,a trading method that focuses on notable past highsand thesignals of mBDSRshow strong compatibility.
Also in this example, by placing the stop loss just slightly below the most recent low,a trade with favorable risk-rewardis achievable.
An indicator that shines when combined with RCI: BODSOR・mBDSR
Methods and Case Studies (PDF) ★GogoJungle AWARD 2020 Winner★
https://www.gogojungle.co.jp/tools/indicators/11836
The PDF file includes 320 items (over 1,000 pages, over 350,000 words in total).
Many of them areexamples that use three RCI lines to logically link higher and lower timeframes, sequentially analyze the status of multiple lower timeframes, and finally wait for pullbacks or rebounds on the lower timeframe (i.e., the mBDSR signal)..
Additionally,many focus on identifying points where multiple entry reasons overlap..
Furthermore,it also includes methods for exploring upward and downward targets using three RCI lines..
In the PDF explanations,over 1,000 chartsare used.
× ![]()


