

Prominent highs in the upper timeframe and pullback buying signal with mBDSR (RCI 2-band filter)
Indicator that demonstrates power when combined with RCI: BODSOR・mBDSR
Principle and case studies (PDF) ★GogoJungle AWARD 2020 Winner★
https://www.gogojungle.co.jp/tools/indicators/11836
EUR/USD 4-hour chart
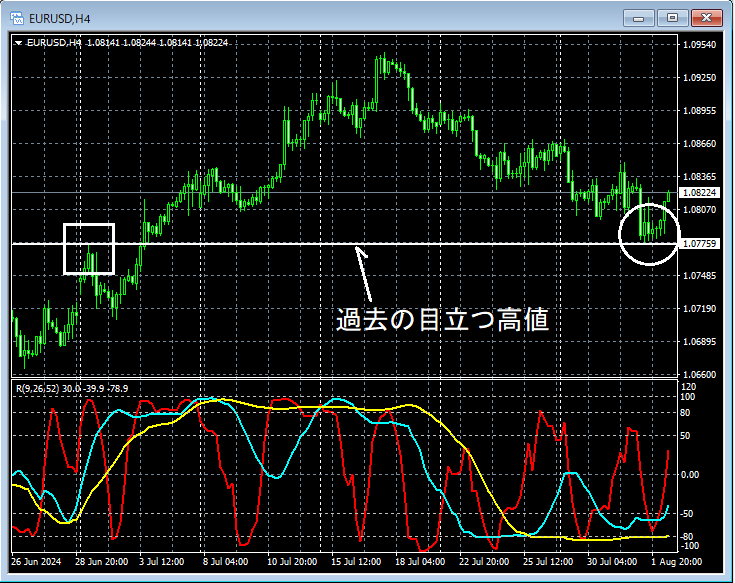
If you look at the area circled in white on the 4-hour chart above,you can see that prices have fallen toward nearby past notable highsand it might not be strange to expect a slight rise. We will check for signs of a rebound on lower time frames.
EUR/USD 5-minute chart
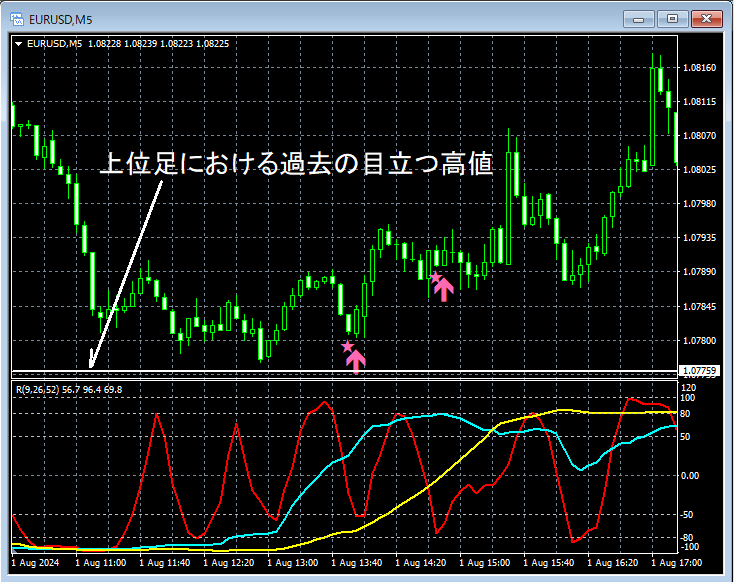
In the 5-minute chart above,price has fallen toward the past notable high on the higher time frameand then shows a rebound. mBDSR (RCI two-line filter) pullback buying signalmBDSR (RCI two-line filter) pullback buying signallights up, and subsequently the price rises solidly.
From this example,it is evident that there is a high synergy between the trading method focusing on past notable highsandthe signals of mBDSR.
Indicator that shines when combined with RCI: BODSOR・mBDSR
method and case studies (PDF) ★GogoJungle AWARD 2020 Winner★
https://www.gogojungle.co.jp/tools/indicators/11836
The PDF file includes 320 items (over 1,000 pages, over 350,000 characters in total).
Many of thempresent examples that link higher and lower time frames logically using the RCI three-line setup, then sequentially analyze the conditions of multiple lower time frames, ultimately waiting for pullback buys or pullback sells on the lower time frame (i.e., the signals of mBDSR)..
Additionally,there are many that emphasize identifying points where multiple entry reasons coincide..
Also included is a method for exploring upside and downside targets using the RCI three-line setup.
In the PDF explanations,more than 1,000 chartsare used.

Principle and case studies (PDF) ★GogoJungle AWARD 2020 Winner★
https://www.gogojungle.co.jp/tools/indicators/11836
EUR/USD 4-hour chart
If you look at the area circled in white on the 4-hour chart above,you can see that prices have fallen toward nearby past notable highsand it might not be strange to expect a slight rise. We will check for signs of a rebound on lower time frames.
EUR/USD 5-minute chart
In the 5-minute chart above,price has fallen toward the past notable high on the higher time frameand then shows a rebound. mBDSR (RCI two-line filter) pullback buying signalmBDSR (RCI two-line filter) pullback buying signallights up, and subsequently the price rises solidly.
From this example,it is evident that there is a high synergy between the trading method focusing on past notable highsandthe signals of mBDSR.
Indicator that shines when combined with RCI: BODSOR・mBDSR
method and case studies (PDF) ★GogoJungle AWARD 2020 Winner★
https://www.gogojungle.co.jp/tools/indicators/11836
The PDF file includes 320 items (over 1,000 pages, over 350,000 characters in total).
Many of thempresent examples that link higher and lower time frames logically using the RCI three-line setup, then sequentially analyze the conditions of multiple lower time frames, ultimately waiting for pullback buys or pullback sells on the lower time frame (i.e., the signals of mBDSR)..
Additionally,there are many that emphasize identifying points where multiple entry reasons coincide..
Also included is a method for exploring upside and downside targets using the RCI three-line setup.
In the PDF explanations,more than 1,000 chartsare used.
× ![]()


