

Dow Theory, moving averages, counter-trend line, double top, neckline, and mBDSR (RCI two-filter) pullback sell signal
0
Indicator that shines when combined with RCI【BODSOR・mBDSR】
Methods and Case Studies (PDF) ★GogoJungle AWARD2020 Winner★
https://www.gogojungle.co.jp/tools/indicators/11836
Bitcoin / USD BTCUSD 4-hour chart
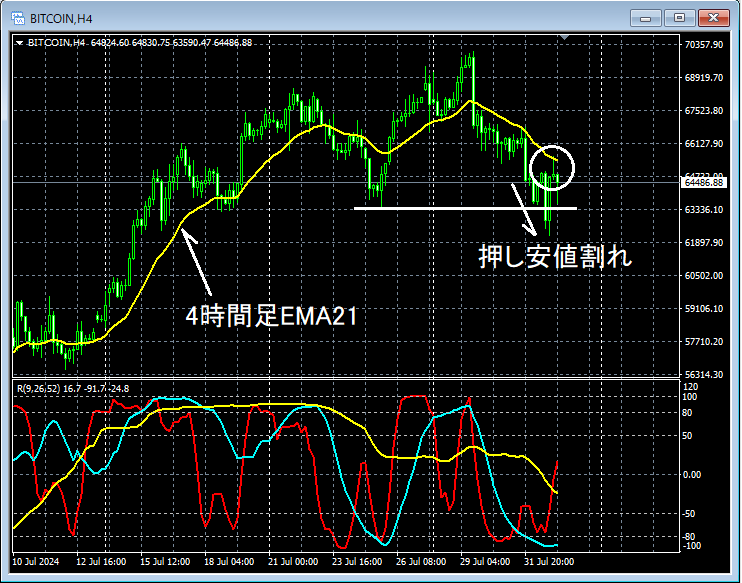
In the 4-hour chart above,the price has broken the support lowand is rising afterward.Approaching the 4-hour EMA21to assess on a lower timeframe.Support lowhas been briefly breached, so the overall trend is downward.
Bitcoin / USD BTCUSD 15-minute chart
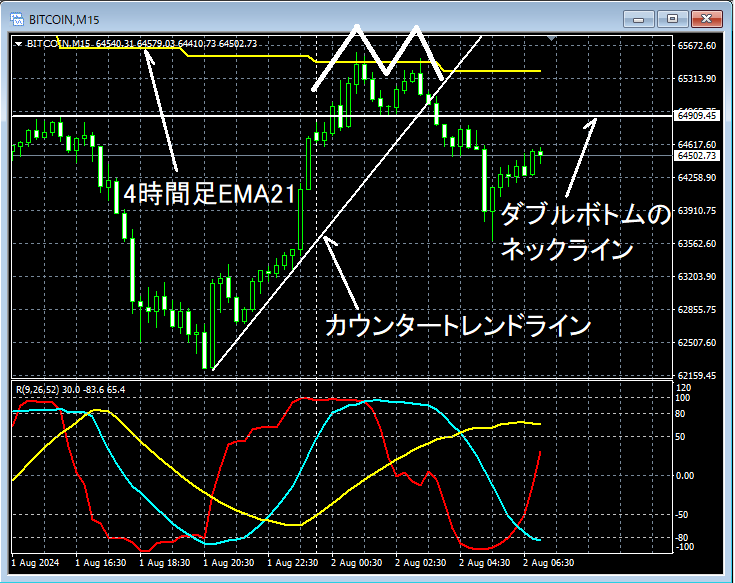
In the 15-minute chart above,the price rose to around the EMA21 on the 4-hour chart,broke the counter-trend lineandthe double-top neckline. Furthermore, we will look in more detail at the 5-minute chart.
Bitcoin / USD BTCUSD 5-minute chart
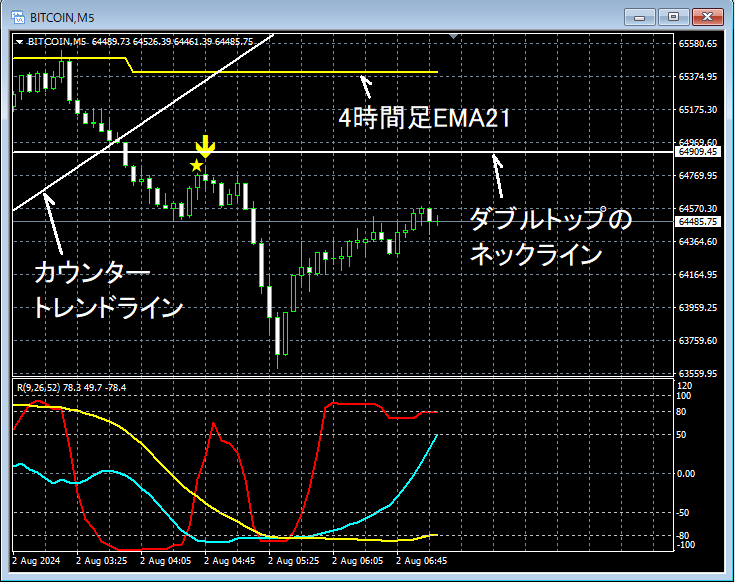
In the 5-minute chart above,near the double-top neckline,mBDSR (RCI two-line filter)sell signal appeared, and price subsequently moved decisively downward.
From this example,a trading approach focused on Dow Theory (support and resistance), counter-trend lines, double-top necklines, and moving averagesand the signals of mBDSRshow a strong compatibility.
Indicator that shines when combined with RCI【BODSOR・mBDSR】
Methods and Case Studies (PDF) ★GogoJungle AWARD2020 Winner★
https://www.gogojungle.co.jp/tools/indicators/11836
The PDF file comes with 320 files (totaling over 1,000 pages and more than 350,000 characters).
Many of them areexamples that logically link higher and lower timeframes using the RCI three-line setup, examining multiple lower-timeframe conditions step by step, and eventually waiting for the timing to buy on dips or sell on rebounds on the lower timeframes (i.e., mBDSR signals).
Also,many focus on identifying points where multiple entry reasons overlap.
Additionally,it also includes methods that explore upward and downward targets using the RCI three-line setup..
In the PDF explanations,over 1,000 charts are used..

Methods and Case Studies (PDF) ★GogoJungle AWARD2020 Winner★
https://www.gogojungle.co.jp/tools/indicators/11836
Bitcoin / USD BTCUSD 4-hour chart
In the 4-hour chart above,the price has broken the support lowand is rising afterward.Approaching the 4-hour EMA21to assess on a lower timeframe.Support lowhas been briefly breached, so the overall trend is downward.
Bitcoin / USD BTCUSD 15-minute chart
In the 15-minute chart above,the price rose to around the EMA21 on the 4-hour chart,broke the counter-trend lineandthe double-top neckline. Furthermore, we will look in more detail at the 5-minute chart.
Bitcoin / USD BTCUSD 5-minute chart
In the 5-minute chart above,near the double-top neckline,mBDSR (RCI two-line filter)sell signal appeared, and price subsequently moved decisively downward.
From this example,a trading approach focused on Dow Theory (support and resistance), counter-trend lines, double-top necklines, and moving averagesand the signals of mBDSRshow a strong compatibility.
Indicator that shines when combined with RCI【BODSOR・mBDSR】
Methods and Case Studies (PDF) ★GogoJungle AWARD2020 Winner★
https://www.gogojungle.co.jp/tools/indicators/11836
The PDF file comes with 320 files (totaling over 1,000 pages and more than 350,000 characters).
Many of them areexamples that logically link higher and lower timeframes using the RCI three-line setup, examining multiple lower-timeframe conditions step by step, and eventually waiting for the timing to buy on dips or sell on rebounds on the lower timeframes (i.e., mBDSR signals).
Also,many focus on identifying points where multiple entry reasons overlap.
Additionally,it also includes methods that explore upward and downward targets using the RCI three-line setup..
In the PDF explanations,over 1,000 charts are used..
× ![]()


