

Pin Bar (long lower wick candlestick) and lower-timeframe mBDSR (RCI two-line filter) bullish signal
An indicator that captures the bottom and reversal in combination with RCI: 【mBDSR】
Methods and Case Studies (PDF) ★GogoJungle AWARD2020 Winner★
https://www.gogojungle.co.jp/tools/indicators/11836
The above products include 302 PDF files. For a list of the titles of those PDFs, please see the article below.
About the 302 PDF files included with 【BODSOR・mBDSR】
https://www.gogojungle.co.jp/finance/navi/articles/34271
USDJPY – 4-hour chart
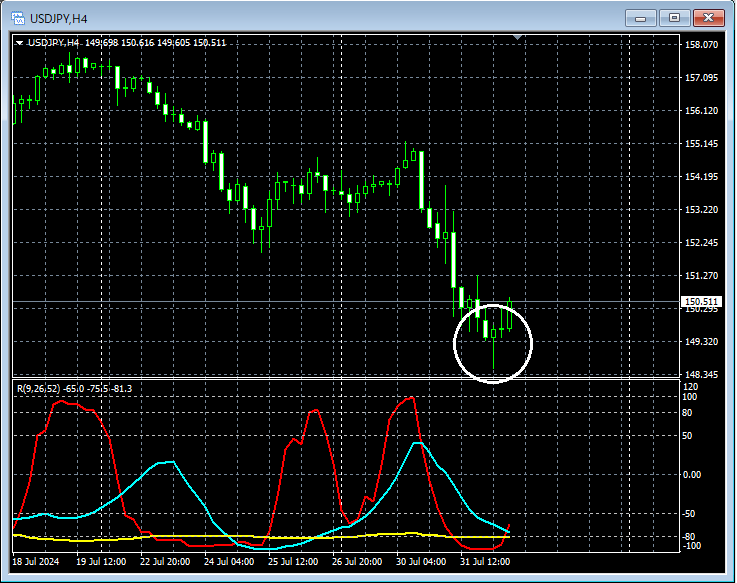
Looking at the area circled in white on the 4-hour chart above, it suggests an uptrendPin Bar (candlestick with a long lower shadow)appears. It might be a reasonable point to consider a dip-buy on a lower timeframe.
USDJPY – 30-minute chart
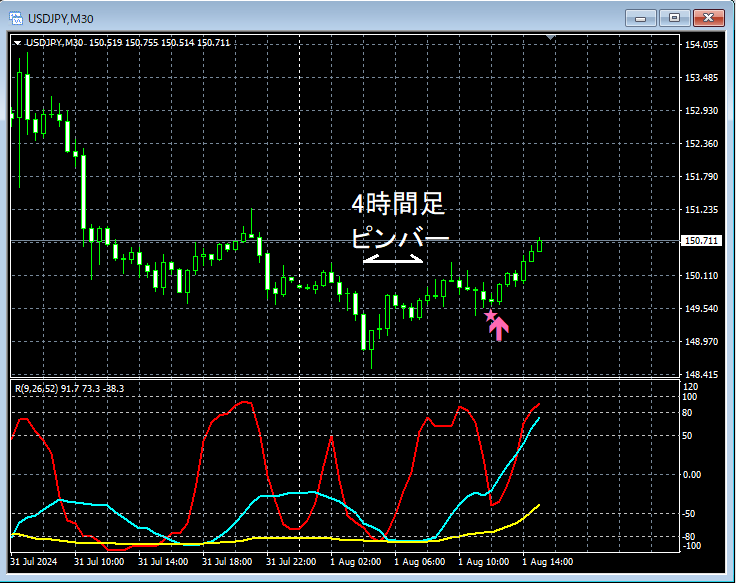
On the 30-minute chart above, thePin Bar (long lower shadow)appearance is followed by a rise,mBDSR (Filter: RCI26 and RCI52) dip-buy signallights up and prices rise steadily.
From this example,the trading method focusing on Pin Bar (long lower shadow)andthe mBDSR signalshow a strong compatibility.
Indicator that shines in combination with RCI:【BODSOR・mBDSR】
Methods and Case Studies (PDF) ★GogoJungle AWARD2020 Winner★
https://www.gogojungle.co.jp/tools/indicators/11836
PDF files include 302 items (over 1,000 pages in total, over 350,000 characters in total).
Many of them are abouta logical linkage between higher and lower timeframes using three RCI lines to sequentially analyze multiple lower timeframes, ultimately waiting for the dip-buy or pullback sell timing (i.e., the mBDSR signal) on the lower timeframeand summarizes this approach.
In addition,many focus on identifying points where multiple entry reasons overlap.
The explanation usesmore than 1,000 chartsin total.

Methods and Case Studies (PDF) ★GogoJungle AWARD2020 Winner★
https://www.gogojungle.co.jp/tools/indicators/11836
The above products include 302 PDF files. For a list of the titles of those PDFs, please see the article below.
About the 302 PDF files included with 【BODSOR・mBDSR】
https://www.gogojungle.co.jp/finance/navi/articles/34271
USDJPY – 4-hour chart
Looking at the area circled in white on the 4-hour chart above, it suggests an uptrendPin Bar (candlestick with a long lower shadow)appears. It might be a reasonable point to consider a dip-buy on a lower timeframe.
USDJPY – 30-minute chart
On the 30-minute chart above, thePin Bar (long lower shadow)appearance is followed by a rise,mBDSR (Filter: RCI26 and RCI52) dip-buy signallights up and prices rise steadily.
From this example,the trading method focusing on Pin Bar (long lower shadow)andthe mBDSR signalshow a strong compatibility.
Indicator that shines in combination with RCI:【BODSOR・mBDSR】
Methods and Case Studies (PDF) ★GogoJungle AWARD2020 Winner★
https://www.gogojungle.co.jp/tools/indicators/11836
PDF files include 302 items (over 1,000 pages in total, over 350,000 characters in total).
Many of them are abouta logical linkage between higher and lower timeframes using three RCI lines to sequentially analyze multiple lower timeframes, ultimately waiting for the dip-buy or pullback sell timing (i.e., the mBDSR signal) on the lower timeframeand summarizes this approach.
In addition,many focus on identifying points where multiple entry reasons overlap.
The explanation usesmore than 1,000 chartsin total.
× ![]()


