

Sakata Five Methods “Evening Star” and mBDSR Buy Signal on the Dip (4)
0
Indicator that captures “tops and bottoms and reversals” in combination with RCI 【mBDSR】
Methods, case studies (PDF) ★GogoJungle AWARD2020 Winner★
https://www.gogojungle.co.jp/tools/indicators/11836
The above product includes 302 PDFs (methods, case studies, etc.). For the list of PDF titles and other details, please refer to the article below.
About the 302 PDF files included with 【BODSOR・mBDSR】
https://www.gogojungle.co.jp/finance/navi/articles/34271
EURJPY 15-minute chart
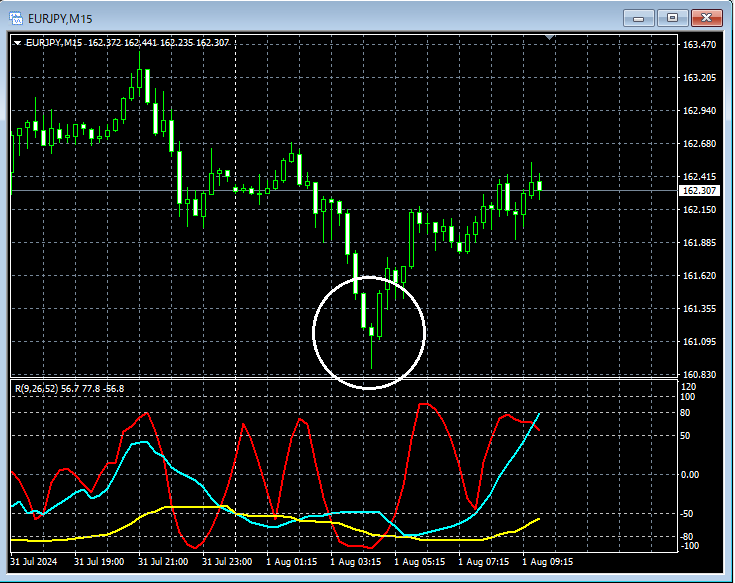
When looking at the area circled in white on the 15-minute chart aboveSakata Shichiso’s “Morning Star”appears. This candlestick pattern suggests a bullish reversal, and it might be a good setup to consider buying on dips on lower time frames.
EURJPY 5-minute chart
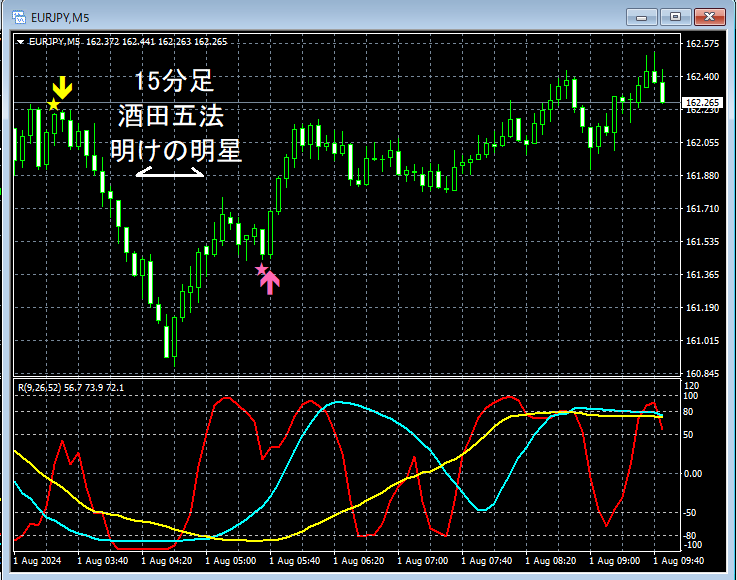
On the higher 15-minute time frame,Sakata Shichiso’s “Morning Star”appears, and on the higher 5-minute chart,mBDSR (two-RCI filter) buy-on-dip signallights up and the price rises smoothly.
From this example,a trading approach that focuses on Sakata Shichiso’s “Morning Star”andthe signals of mBDSRshows strong compatibility.
The indicator that shines in combination with RCI: 【BODSOR・mBDSR】
Methods, case studies (PDF) ★GogoJungle AWARD2020 Winner★
https://www.gogojungle.co.jp/tools/indicators/11836
The PDF files total 302.
Many of them are compiled as examples that logically link higher and lower timeframes by using three RCI lines, sequentially considering conditions across multiple lower timeframes, and ultimately waiting for the timing of pullbacks in the lower timeframes (i.e., the mBDSR signals) to enter—either buying on dips or selling into rallies.Additionally,
many of them emphasize identifying points where multiple entry reasons overlap.There are many such examples.
The explanations usemore than 1,000 chartsin total.

Methods, case studies (PDF) ★GogoJungle AWARD2020 Winner★
https://www.gogojungle.co.jp/tools/indicators/11836
The above product includes 302 PDFs (methods, case studies, etc.). For the list of PDF titles and other details, please refer to the article below.
About the 302 PDF files included with 【BODSOR・mBDSR】
https://www.gogojungle.co.jp/finance/navi/articles/34271
EURJPY 15-minute chart
When looking at the area circled in white on the 15-minute chart aboveSakata Shichiso’s “Morning Star”appears. This candlestick pattern suggests a bullish reversal, and it might be a good setup to consider buying on dips on lower time frames.
EURJPY 5-minute chart
On the higher 15-minute time frame,Sakata Shichiso’s “Morning Star”appears, and on the higher 5-minute chart,mBDSR (two-RCI filter) buy-on-dip signallights up and the price rises smoothly.
From this example,a trading approach that focuses on Sakata Shichiso’s “Morning Star”andthe signals of mBDSRshows strong compatibility.
The indicator that shines in combination with RCI: 【BODSOR・mBDSR】
Methods, case studies (PDF) ★GogoJungle AWARD2020 Winner★
https://www.gogojungle.co.jp/tools/indicators/11836
The PDF files total 302.
Many of them are compiled as examples that logically link higher and lower timeframes by using three RCI lines, sequentially considering conditions across multiple lower timeframes, and ultimately waiting for the timing of pullbacks in the lower timeframes (i.e., the mBDSR signals) to enter—either buying on dips or selling into rallies.Additionally,
many of them emphasize identifying points where multiple entry reasons overlap.There are many such examples.
The explanations usemore than 1,000 chartsin total.
× ![]()


