

Declining flag and mBDSR (RCI2 two-pole filter) sell signal (2)
0
Indicator "Grasping Tops/Bottoms and Reversals" in combination with RCI【mBDSR】
Methods and Case Studies (PDF) ★GogoJungle AWARD2020 winner★
https://www.gogojungle.co.jp/tools/indicators/11836
The above products include 302 PDFs (methods, case studies, etc.). For a list of the PDF titles, please see the article below.
About the 302 PDF files included with 【BODSOR・mBDSR】
https://www.gogojungle.co.jp/finance/navi/articles/34271
New Zealand Dollar / Yen NZDJPY 5-minute chart
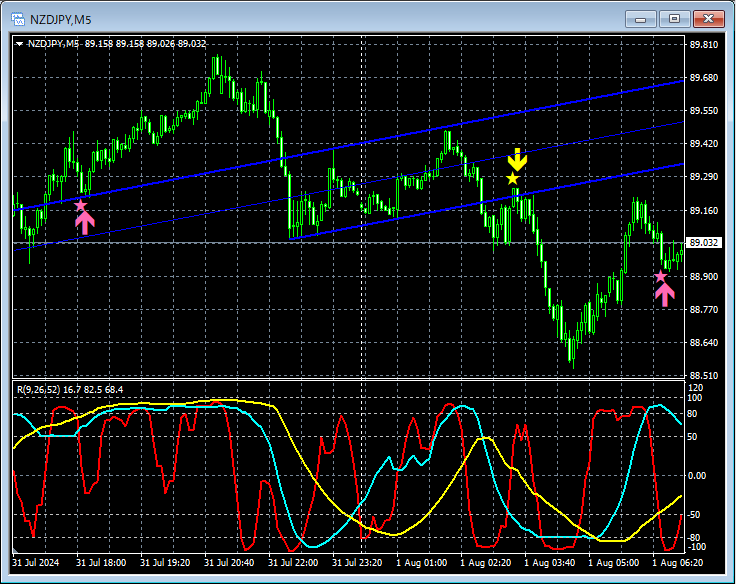
On the 5-minute chart above,downward flagis broken to the downside,mBDSR (RCI two-filter) pullback selling signallights up, and subsequently the price drops sharply.
From this example,a trading method focused on the downward flagandthe compatibility with mBDSR signalsare evident.
Indicator【BODSOR・mBDSR】that excels in combination with RCI
Methods and Case Studies (PDF) ★GogoJungle AWARD2020 winner★
https://www.gogojungle.co.jp/tools/indicators/11836
302 PDF files are included.
Many of them document how to logically link higher and lower timeframes using three RCI lines, sequentially analyze the conditions of multiple lower timeframes, and ultimately wait for entry timing on the lower timeframes (i.e., mBDSR signals) for buying on dips or selling on rallies.This is one such summarized example.
Additionally,many of them emphasize identifying points where multiple entry reasons overlap.There are many of these.
The explanations usemore than 1,000 charts in total..

Methods and Case Studies (PDF) ★GogoJungle AWARD2020 winner★
https://www.gogojungle.co.jp/tools/indicators/11836
The above products include 302 PDFs (methods, case studies, etc.). For a list of the PDF titles, please see the article below.
About the 302 PDF files included with 【BODSOR・mBDSR】
https://www.gogojungle.co.jp/finance/navi/articles/34271
New Zealand Dollar / Yen NZDJPY 5-minute chart
On the 5-minute chart above,downward flagis broken to the downside,mBDSR (RCI two-filter) pullback selling signallights up, and subsequently the price drops sharply.
From this example,a trading method focused on the downward flagandthe compatibility with mBDSR signalsare evident.
Indicator【BODSOR・mBDSR】that excels in combination with RCI
Methods and Case Studies (PDF) ★GogoJungle AWARD2020 winner★
https://www.gogojungle.co.jp/tools/indicators/11836
302 PDF files are included.
Many of them document how to logically link higher and lower timeframes using three RCI lines, sequentially analyze the conditions of multiple lower timeframes, and ultimately wait for entry timing on the lower timeframes (i.e., mBDSR signals) for buying on dips or selling on rallies.This is one such summarized example.
Additionally,many of them emphasize identifying points where multiple entry reasons overlap.There are many of these.
The explanations usemore than 1,000 charts in total..
× ![]()


