

Rising wedge and mBDSR (RCI2 dual-filter) overbought signal (4)
An indicator that captures the bottom and reversal when combined with RCI: 【mBDSR】
Methods and case studies (PDF) ★GogoJungle AWARD2020 Winner★
https://www.gogojungle.co.jp/tools/indicators/11836
The products above include 301 PDFs (methods, case studies, etc.). For a list of the PDF titles, please refer to the article below.
About the 301 PDF files included with 【BODSOR・mBDSR】
https://www.gogojungle.co.jp/finance/navi/articles/34271
EURJPY 5-minute chart
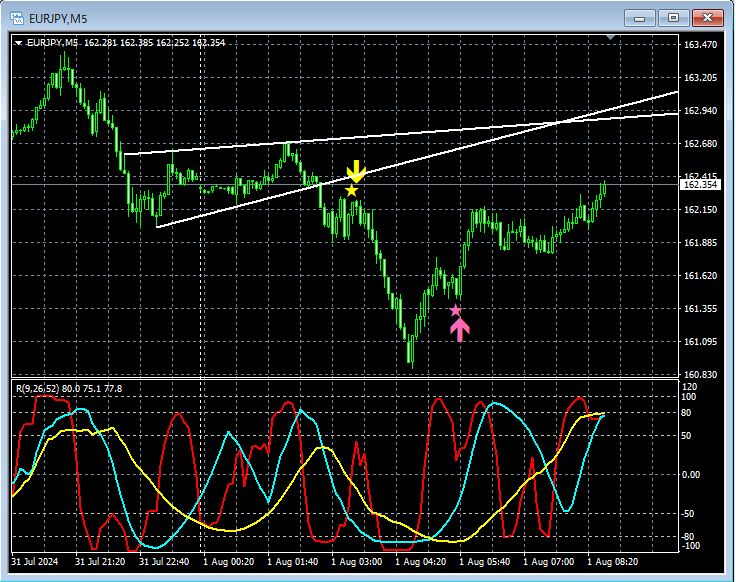
On the 5-minute chart above,the support line of the rising wedgewas broken to the downside followed by a rally,the mBDSR (RCI two-line filter) mean-reversion sell signallit up, and thereafter price moved sharply lower.
From this example,a trading method focused on wedgesandthe signals of mBDSRshow a strong synergy.
Additionally, in the subsequent upward phase of this example,the mBDSR (RCI two-line filter) pullback-buy signaltimely lit up.
Indicator that shines when combined with RCI: 【BODSOR・mBDSR】
Methods and case studies (PDF) ★GogoJungle AWARD2020 Winner★
https://www.gogojungle.co.jp/tools/indicators/11836
The PDFs come with 301 files.
Many of them are compiled cases that describe logically linking higher and lower timeframes using three RCI lines, sequentially considering the conditions of multiple lower timeframes, and ultimately waiting for pullbacks or return signals on the lower timeframes (i.e., mBDSR signals).
Also,many focus on pinpointing points where multiple entry reasons overlap.
The explanations usemore than 1,000 charts in total.

Methods and case studies (PDF) ★GogoJungle AWARD2020 Winner★
https://www.gogojungle.co.jp/tools/indicators/11836
The products above include 301 PDFs (methods, case studies, etc.). For a list of the PDF titles, please refer to the article below.
About the 301 PDF files included with 【BODSOR・mBDSR】
https://www.gogojungle.co.jp/finance/navi/articles/34271
EURJPY 5-minute chart
On the 5-minute chart above,the support line of the rising wedgewas broken to the downside followed by a rally,the mBDSR (RCI two-line filter) mean-reversion sell signallit up, and thereafter price moved sharply lower.
From this example,a trading method focused on wedgesandthe signals of mBDSRshow a strong synergy.
Additionally, in the subsequent upward phase of this example,the mBDSR (RCI two-line filter) pullback-buy signaltimely lit up.
Indicator that shines when combined with RCI: 【BODSOR・mBDSR】
Methods and case studies (PDF) ★GogoJungle AWARD2020 Winner★
https://www.gogojungle.co.jp/tools/indicators/11836
The PDFs come with 301 files.
Many of them are compiled cases that describe logically linking higher and lower timeframes using three RCI lines, sequentially considering the conditions of multiple lower timeframes, and ultimately waiting for pullbacks or return signals on the lower timeframes (i.e., mBDSR signals).
Also,many focus on pinpointing points where multiple entry reasons overlap.
The explanations usemore than 1,000 charts in total.
× ![]()


