

Bearish signal on an ascending wedge and mBDSR (RCI two-band filter) return sale (3)
Indicator 【mBDSR】 that captures “tops and bottoms and reversals” in combination with RCI
Methods and Case Studies (PDF) ★GogoJungle AWARD2020 Winner★
https://www.gogojungle.co.jp/tools/indicators/11836
The above products include 301 PDFs (methods, case studies, etc.). For a list of the PDF titles, please refer to the article below.
About the 301 PDF files accompanying 【BODSOR・mBDSR】
https://www.gogojungle.co.jp/finance/navi/articles/34271
USD/JPY 4-hour chart
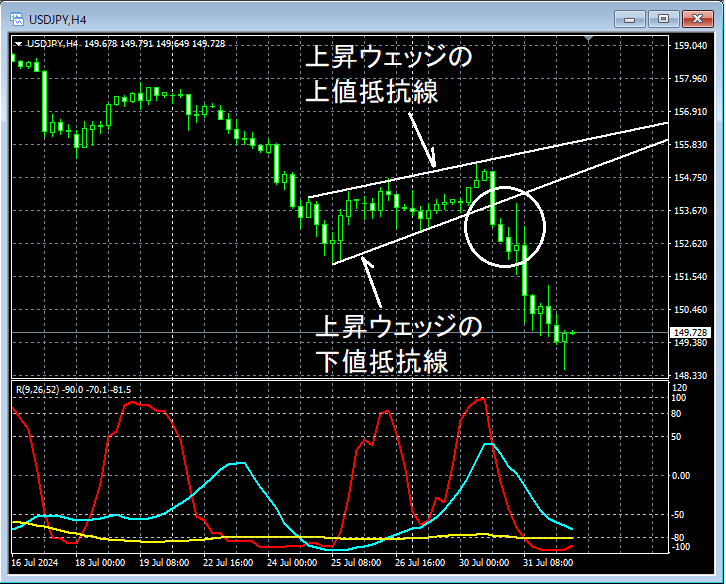
If you look at the area circled in white on the above 4-hour chart,the lower support line of the ascending wedge has been broken, which may be a scene where it’s reasonable to consider selling on rallies on lower time frames. Let’s examine the lower time frame.
USD/JPY 1-hour chart
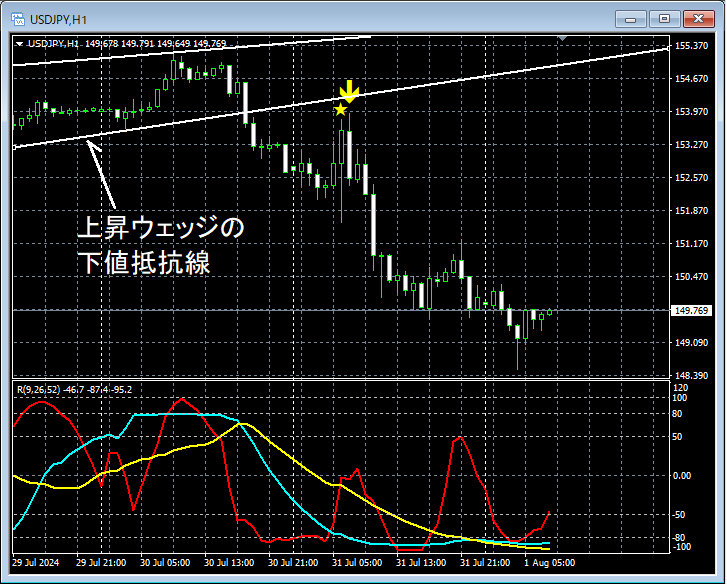
In the above 1-hour chart,the lower support line of the ascending wedgeis broken followed by a rally,the mBDSR (2 RCI lines filter) overbought signallights up, and price subsequently falls sharply.
From this example,the trading method focusing on wedgesandthe harmony with mBDSR signalsappear to be highly compatible.
Indicator that shines in combination with RCI: 【BODSOR・mBDSR】
Methods and Case Studies (PDF) ★GogoJungle AWARD2020 Winner★
https://www.gogojungle.co.jp/tools/indicators/11836
301 PDF files are included.
Many of them demonstrate a process of logically linking higher and lower time frames using the three RCI lines, gradually examining multiple lower time frames, and ultimately waiting for pullbacks or rallies on the lower time frames (i.e., mBDSR signals).They are compiled as examples of this approach.
In addition,they place emphasis on capturing points where multiple entry reasons overlapas well.
The explanations usemore than 1,000 chartsin total.

Methods and Case Studies (PDF) ★GogoJungle AWARD2020 Winner★
https://www.gogojungle.co.jp/tools/indicators/11836
The above products include 301 PDFs (methods, case studies, etc.). For a list of the PDF titles, please refer to the article below.
About the 301 PDF files accompanying 【BODSOR・mBDSR】
https://www.gogojungle.co.jp/finance/navi/articles/34271
USD/JPY 4-hour chart
If you look at the area circled in white on the above 4-hour chart,the lower support line of the ascending wedge has been broken, which may be a scene where it’s reasonable to consider selling on rallies on lower time frames. Let’s examine the lower time frame.
USD/JPY 1-hour chart
In the above 1-hour chart,the lower support line of the ascending wedgeis broken followed by a rally,the mBDSR (2 RCI lines filter) overbought signallights up, and price subsequently falls sharply.
From this example,the trading method focusing on wedgesandthe harmony with mBDSR signalsappear to be highly compatible.
Indicator that shines in combination with RCI: 【BODSOR・mBDSR】
Methods and Case Studies (PDF) ★GogoJungle AWARD2020 Winner★
https://www.gogojungle.co.jp/tools/indicators/11836
301 PDF files are included.
Many of them demonstrate a process of logically linking higher and lower time frames using the three RCI lines, gradually examining multiple lower time frames, and ultimately waiting for pullbacks or rallies on the lower time frames (i.e., mBDSR signals).They are compiled as examples of this approach.
In addition,they place emphasis on capturing points where multiple entry reasons overlapas well.
The explanations usemore than 1,000 chartsin total.
× ![]()


