

Ascending wedge and mBDSR (RCI2-band filter) short signal (2)
Indicator 【mBDSR】 that captures bottoming and reversals in combination with RCI
and methods・case studies (PDF) ★GogoJungle AWARD2020 Winner★
https://www.gogojungle.co.jp/tools/indicators/11836
The above products include 301 PDFs (methods, case studies, etc.). For the list of titles of those PDFs, please see the article below.
About the 301 PDF files included with 【BODSOR・mBDSR】
https://www.gogojungle.co.jp/finance/navi/articles/34271
AUDCAD on 1-hour chart
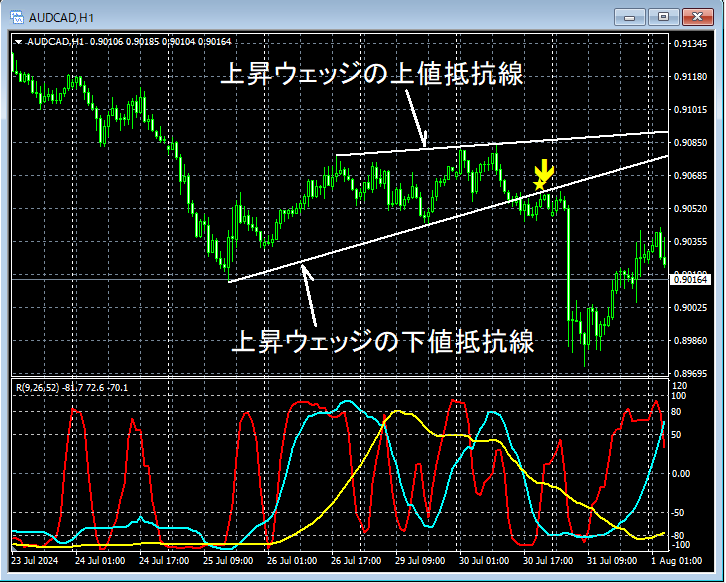
In the 1-hour chart above,the rising wedge lower support linewas broken to the downside,the mBDSR (two RCI lines) reversal sell signallights up, and thereafter the price declined sharply.
From this example,a trading method focused on wedgesandthe compatibility with mBDSR signalsappear highly compatible.
Indicator 【BODSOR・mBDSR】 that proves powerful in combination with RCI
and methods・case studies (PDF) ★GogoJungle AWARD2020 Winner★
https://www.gogojungle.co.jp/tools/indicators/11836
301 PDF files are included.
Many of them aresummaries of cases where RCI3 lines are used to logically connect higher and lower timeframes, examining multiple lower-timeframe conditions sequentially, and ultimately waiting for pullbacks or reversals on the lower timeframes (i.e., mBDSR signals).
Additionally,many focus on capturing points where multiple entry reasons overlap.
In the explanations,more than 1,000 chartshave been used.

and methods・case studies (PDF) ★GogoJungle AWARD2020 Winner★
https://www.gogojungle.co.jp/tools/indicators/11836
The above products include 301 PDFs (methods, case studies, etc.). For the list of titles of those PDFs, please see the article below.
About the 301 PDF files included with 【BODSOR・mBDSR】
https://www.gogojungle.co.jp/finance/navi/articles/34271
AUDCAD on 1-hour chart
In the 1-hour chart above,the rising wedge lower support linewas broken to the downside,the mBDSR (two RCI lines) reversal sell signallights up, and thereafter the price declined sharply.
From this example,a trading method focused on wedgesandthe compatibility with mBDSR signalsappear highly compatible.
Indicator 【BODSOR・mBDSR】 that proves powerful in combination with RCI
and methods・case studies (PDF) ★GogoJungle AWARD2020 Winner★
https://www.gogojungle.co.jp/tools/indicators/11836
301 PDF files are included.
Many of them aresummaries of cases where RCI3 lines are used to logically connect higher and lower timeframes, examining multiple lower-timeframe conditions sequentially, and ultimately waiting for pullbacks or reversals on the lower timeframes (i.e., mBDSR signals).
Additionally,many focus on capturing points where multiple entry reasons overlap.
In the explanations,more than 1,000 chartshave been used.
× ![]()


