

Rising wedge and mBDSR (RCI2-band filter) short signal (1)
0
Indicator that captures the bottom and reversal in combination with RCI: 【mBDSR】
Methods and Case Studies (PDF) ★GogoJungle AWARD2020 Winner★
https://www.gogojungle.co.jp/tools/indicators/11836
The above products include 301 PDFs (methods, case studies, etc.). For a list of the titles of those PDFs, please refer to the article below.
About the 301 PDF files included in 【BODSOR・mBDSR】
https://www.gogojungle.co.jp/finance/navi/articles/34271
AUDCHF (Australian Dollar vs Swiss Franc) 1-hour
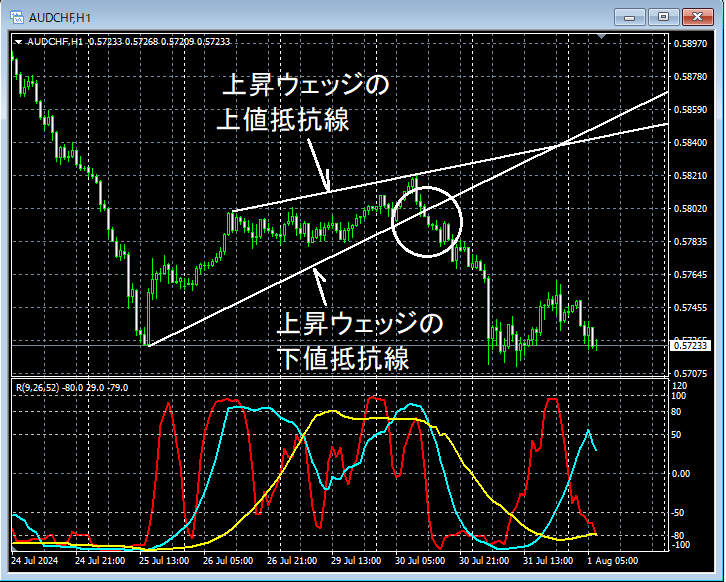
If you look at the area circled by the white circle on the 1-hour chart above,the lower support line of the ascending wedge has been broken, and it may not be unusual to consider selling on rallies on lower timeframes. Let us look at the lower timeframes
AUDCHF 30-minute
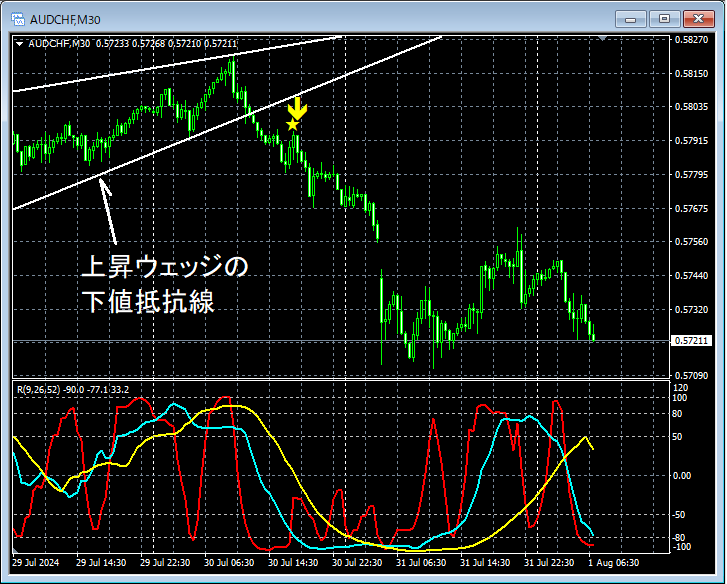
On the 30-minute chart above,the lower support line of the ascending wedgewas broken and then rose,the return-sell signal of mBDSR (2 RCI lines filter)lit up, and subsequently the price dropped sharply.
From this example,a trading method focused on wedgesandthe signals of mBDSRshow a high degree of compatibility.
Indicator that shines in combination with RCI: 【BODSOR・mBDSR】
Methods and Case Studies (PDF) ★GogoJungle AWARD2020 Winner★
https://www.gogojungle.co.jp/tools/indicators/11836
The PDF files include 301 items.
Many of them are examples that detail how to logically link higher and lower timeframes using three RCI lines, sequentially examining multiple lower timeframes, and ultimately waiting for timing to buy on dips or sell on rallies on the lower timeframe (i.e., the signals of mBDSR).They are compiled as such.
Also,many of them focus on identifying points where multiple entry reasons overlap.
The explanations usemore than 1,000 charts.

Methods and Case Studies (PDF) ★GogoJungle AWARD2020 Winner★
https://www.gogojungle.co.jp/tools/indicators/11836
The above products include 301 PDFs (methods, case studies, etc.). For a list of the titles of those PDFs, please refer to the article below.
About the 301 PDF files included in 【BODSOR・mBDSR】
https://www.gogojungle.co.jp/finance/navi/articles/34271
AUDCHF (Australian Dollar vs Swiss Franc) 1-hour
If you look at the area circled by the white circle on the 1-hour chart above,the lower support line of the ascending wedge has been broken, and it may not be unusual to consider selling on rallies on lower timeframes. Let us look at the lower timeframes
AUDCHF 30-minute
On the 30-minute chart above,the lower support line of the ascending wedgewas broken and then rose,the return-sell signal of mBDSR (2 RCI lines filter)lit up, and subsequently the price dropped sharply.
From this example,a trading method focused on wedgesandthe signals of mBDSRshow a high degree of compatibility.
Indicator that shines in combination with RCI: 【BODSOR・mBDSR】
Methods and Case Studies (PDF) ★GogoJungle AWARD2020 Winner★
https://www.gogojungle.co.jp/tools/indicators/11836
The PDF files include 301 items.
Many of them are examples that detail how to logically link higher and lower timeframes using three RCI lines, sequentially examining multiple lower timeframes, and ultimately waiting for timing to buy on dips or sell on rallies on the lower timeframe (i.e., the signals of mBDSR).They are compiled as such.
Also,many of them focus on identifying points where multiple entry reasons overlap.
The explanations usemore than 1,000 charts.
× ![]()


