

Significant lows and counter-trend line and mBDSR (RCI with 2 filters) short selling signal
0
Indicator that captures the bottom/top reversal with RCI combination【mBDSR】
Methods and Case Studies (PDF) ★GogoJungle AWARD2020 Winner★
https://www.gogojungle.co.jp/tools/indicators/11836
The above products include 301 PDFs (methods, case studies, etc.). For the list of PDF titles, etc., please see the article below.
About the 301 PDF files included with 【BODSOR・mBDSR】
https://www.gogojungle.co.jp/finance/navi/articles/34271
AUDCAD on the Australian Dollar - 1 hour chart
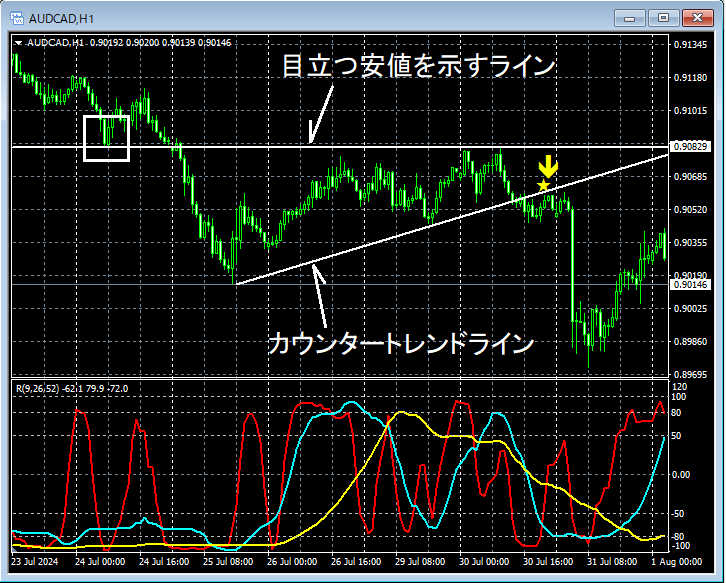
In the above 1-hour chart,a line indicating a conspicuous low could not be broken through and the price fell.The rise after breaking the counter-trend linemBDSR (two RCI lines filter) sell signallights up, and then the price drops significantly.
From this example,a trading method focusing on conspicuous lows and counter-trend linesandthe signal from mBDSRshow a high degree of compatibility.
Indicator that is powerful in combination with RCI: 【BODSOR・mBDSR】
Methods and Case Studies (PDF) ★GogoJungle AWARD2020 Winner★
https://www.gogojungle.co.jp/tools/indicators/11836
The PDF files include 301 files.
Many of them are about logically linking higher and lower timeframes using three RCI lines, examining the conditions of multiple lower timeframes step by step, and ultimately waiting for pullbacks or pullbacks timing on the lower timeframe (i.e., the mBDSR signal).It is summarized as such.
Also,many focus on identifying points where multiple entry reasons overlap.There are many of these.
In the explanations,more than 1,000 chartsare used.

Methods and Case Studies (PDF) ★GogoJungle AWARD2020 Winner★
https://www.gogojungle.co.jp/tools/indicators/11836
The above products include 301 PDFs (methods, case studies, etc.). For the list of PDF titles, etc., please see the article below.
About the 301 PDF files included with 【BODSOR・mBDSR】
https://www.gogojungle.co.jp/finance/navi/articles/34271
AUDCAD on the Australian Dollar - 1 hour chart
In the above 1-hour chart,a line indicating a conspicuous low could not be broken through and the price fell.The rise after breaking the counter-trend linemBDSR (two RCI lines filter) sell signallights up, and then the price drops significantly.
From this example,a trading method focusing on conspicuous lows and counter-trend linesandthe signal from mBDSRshow a high degree of compatibility.
Indicator that is powerful in combination with RCI: 【BODSOR・mBDSR】
Methods and Case Studies (PDF) ★GogoJungle AWARD2020 Winner★
https://www.gogojungle.co.jp/tools/indicators/11836
The PDF files include 301 files.
Many of them are about logically linking higher and lower timeframes using three RCI lines, examining the conditions of multiple lower timeframes step by step, and ultimately waiting for pullbacks or pullbacks timing on the lower timeframe (i.e., the mBDSR signal).It is summarized as such.
Also,many focus on identifying points where multiple entry reasons overlap.There are many of these.
In the explanations,more than 1,000 chartsare used.
× ![]()


