

Elliott Wave and mBDSR (RCI2-Band Filter) Sell Signal
0
Indicator that captures the bottom and reversal by combining with RCI: 【mBDSR】
Methods and Case Studies (PDF) ★GogoJungle AWARD2020 Winner★
https://www.gogojungle.co.jp/tools/indicators/11836
The above product includes 301 PDFs (methods, case studies, etc.). For a list of the PDFs’ titles, please see the article below.
About the 301 PDF files included with 【BODSOR・mBDSR】
https://www.gogojungle.co.jp/finance/navi/articles/34271
CADCHF 30-minute chart
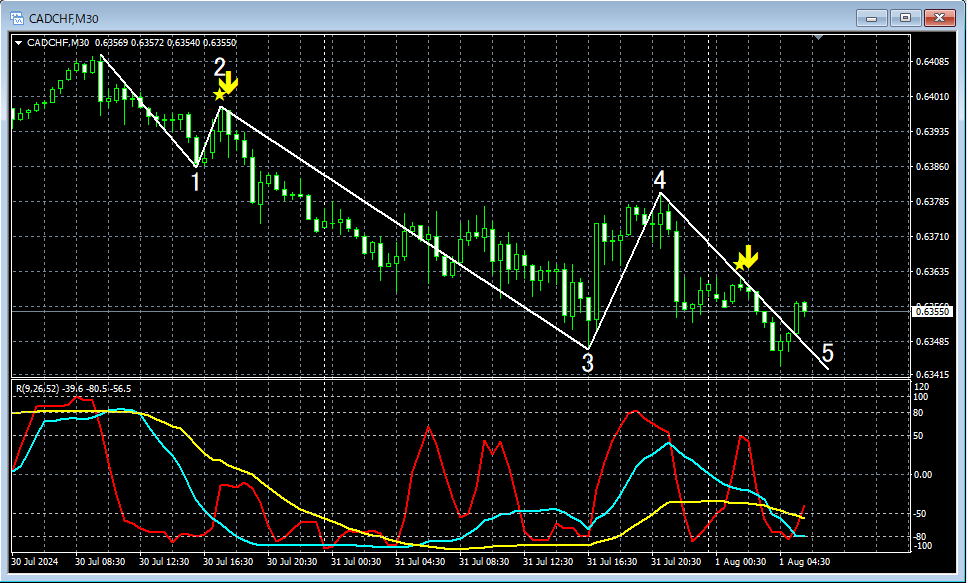
In the 30-minute chart above,5-minute Elliott Waveis displayed. At the start of the 3rd wave’s descent and during the middle of the 5th wave,mBDSR (two RCI filters)signal for selling on a pullback lights up and it declines.
From this example,a trading method focused on Elliott WavesandmBDSR signalsshow high compatibility.
Indicator that shines when combined with RCI: 【BODSOR・mBDSR】
Methods and Case Studies (PDF) ★GogoJungle AWARD2020 Winner★
https://www.gogojungle.co.jp/tools/indicators/11836
PDF files are included: 301 in total.
Many of them are compilations of examples that logically link higher and lower timeframes using three RCI lines to consider multiple sub-timeframe conditions in sequence, and finally wait for pullbacks or pullback-type entries (i.e., mBDSR signals) on the lower timeframe.This is what they amount to.
Also,many focus on identifying points where multiple entry reasons align.There is a heavy emphasis on such points.
In the explanations,more than 1,000 chartsare used.

Methods and Case Studies (PDF) ★GogoJungle AWARD2020 Winner★
https://www.gogojungle.co.jp/tools/indicators/11836
The above product includes 301 PDFs (methods, case studies, etc.). For a list of the PDFs’ titles, please see the article below.
About the 301 PDF files included with 【BODSOR・mBDSR】
https://www.gogojungle.co.jp/finance/navi/articles/34271
CADCHF 30-minute chart
In the 30-minute chart above,5-minute Elliott Waveis displayed. At the start of the 3rd wave’s descent and during the middle of the 5th wave,mBDSR (two RCI filters)signal for selling on a pullback lights up and it declines.
From this example,a trading method focused on Elliott WavesandmBDSR signalsshow high compatibility.
Indicator that shines when combined with RCI: 【BODSOR・mBDSR】
Methods and Case Studies (PDF) ★GogoJungle AWARD2020 Winner★
https://www.gogojungle.co.jp/tools/indicators/11836
PDF files are included: 301 in total.
Many of them are compilations of examples that logically link higher and lower timeframes using three RCI lines to consider multiple sub-timeframe conditions in sequence, and finally wait for pullbacks or pullback-type entries (i.e., mBDSR signals) on the lower timeframe.This is what they amount to.
Also,many focus on identifying points where multiple entry reasons align.There is a heavy emphasis on such points.
In the explanations,more than 1,000 chartsare used.
× ![]()


