

Downtrend line, counter-trend line, and mBDSR (RCI two-filter) pullback selling signal
0
Indicator that captures the bottom and reversal in combination with RCI: 【mBDSR】
Methods and Case Studies (PDF) ★GogoJungle AWARD2020 Winner★
https://www.gogojungle.co.jp/tools/indicators/11836
The above products include 301 PDFs (methods, case studies, etc.). For the list of PDF titles, please see the article below.
About the 301 PDF files included with 【BODSOR・mBDSR】
https://www.gogojungle.co.jp/finance/navi/articles/34271
AUDJPY 1-hour
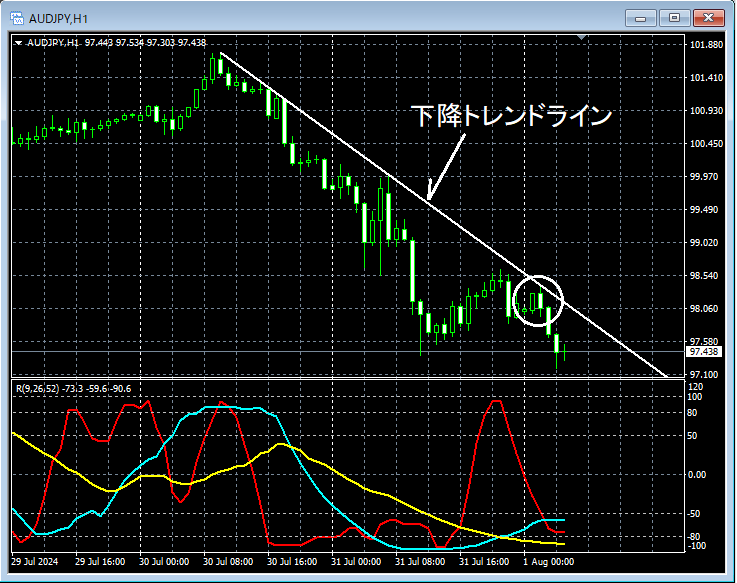
If you look at the area circled in white above on the 1-hour chart,a downward trend lineappears to have reached near there. It wouldn’t be surprising if it dips a little at this time. We will look for signs of downward movement on the lower time frames.
AUDJPY 5-minute
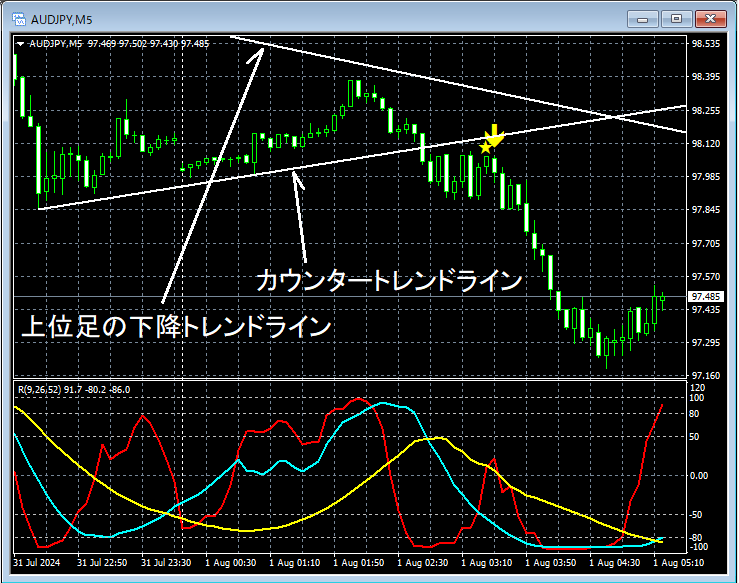
On the above 5-minute chart,near the 1-hour downward trend linethere is a tendency to rebound after rising.After breakout and rebound,Counter-trend linethe mBDSR (RCI two-filter) sell signallights up, and price subsequently falls sharply.
From this example,a trading method that focuses on the higher-time-frame trend linesand thesignals of mBDSRshow strong compatibility.
Indicator that shines in combination with RCI: 【BODSOR・mBDSR】
Methods and Case Studies (PDF) ★GogoJungle AWARD2020 Winner★
https://www.gogojungle.co.jp/tools/indicators/11836
PDF files total 301 included.
Many of them demonstrate an approach where three RCI lines are used to logically link higher and lower time frames, progressively considering multiple lower-time-frame situations, and ultimately waiting for pullbacks or pullbacks timing on the lower time frames (i.e., the mBDSR signals)..
Additionally,many focus on identifying points where multiple entry reasons coincide..
The explanations usemore than 1,000 charts..

Methods and Case Studies (PDF) ★GogoJungle AWARD2020 Winner★
https://www.gogojungle.co.jp/tools/indicators/11836
The above products include 301 PDFs (methods, case studies, etc.). For the list of PDF titles, please see the article below.
About the 301 PDF files included with 【BODSOR・mBDSR】
https://www.gogojungle.co.jp/finance/navi/articles/34271
AUDJPY 1-hour
If you look at the area circled in white above on the 1-hour chart,a downward trend lineappears to have reached near there. It wouldn’t be surprising if it dips a little at this time. We will look for signs of downward movement on the lower time frames.
AUDJPY 5-minute
On the above 5-minute chart,near the 1-hour downward trend linethere is a tendency to rebound after rising.After breakout and rebound,Counter-trend linethe mBDSR (RCI two-filter) sell signallights up, and price subsequently falls sharply.
From this example,a trading method that focuses on the higher-time-frame trend linesand thesignals of mBDSRshow strong compatibility.
Indicator that shines in combination with RCI: 【BODSOR・mBDSR】
Methods and Case Studies (PDF) ★GogoJungle AWARD2020 Winner★
https://www.gogojungle.co.jp/tools/indicators/11836
PDF files total 301 included.
Many of them demonstrate an approach where three RCI lines are used to logically link higher and lower time frames, progressively considering multiple lower-time-frame situations, and ultimately waiting for pullbacks or pullbacks timing on the lower time frames (i.e., the mBDSR signals)..
Additionally,many focus on identifying points where multiple entry reasons coincide..
The explanations usemore than 1,000 charts..
× ![]()


