

Downward trend line and mBDSR (RCI 2-line filter) short signal - strongly mindful of the double top -
0
Indicator that captures “tops and bottoms and reversals” in combination with RCI【mBDSR】
Methods・Case studies (PDF) ★GogoJungle AWARD2020 winner★
https://www.gogojungle.co.jp/tools/indicators/11836
This product includes 301 PDFs (methods, case studies, etc.). For a list of the PDF titles, please see the article below.
About the 301 PDF files included with 【BODSOR・mBDSR】
https://www.gogojungle.co.jp/finance/navi/articles/34271
Swiss Franc Yen CHFJPY 4-hour chart
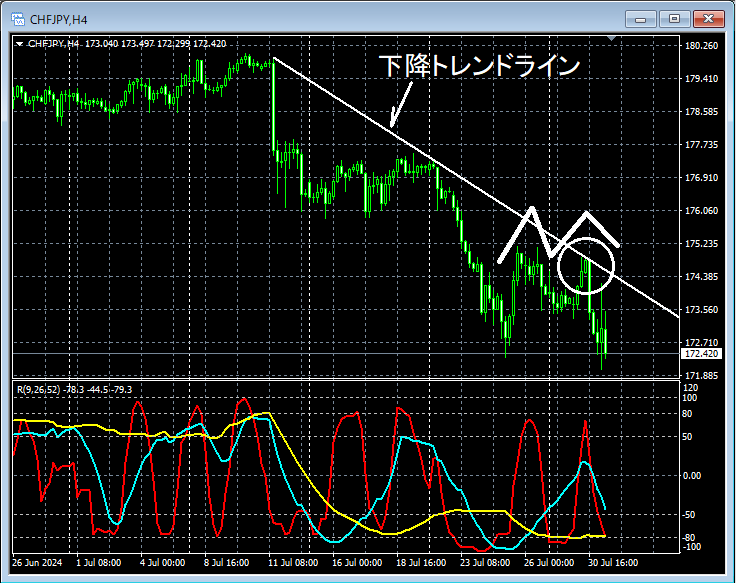
Looking at the area circled in white on the 4-hour chart above,a descending trendlineappears to have been reached. It may not be unusual to consider a slight pullback for a while. We will look for signs of selling on the lower timeframes.
Also, considering the possibility of a decline that would update the low from here, we will be mindful ofa double topas shown in the upper chart.
Swiss Franc Yen CHFJPY 15-minute chart
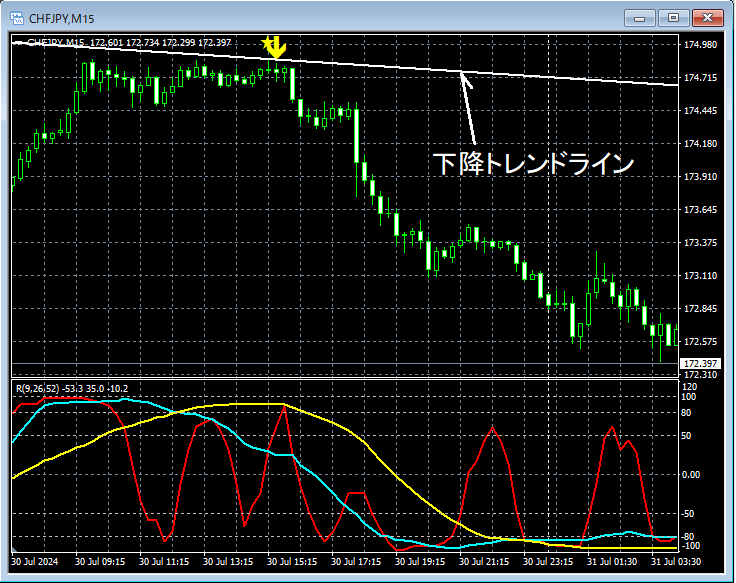
In the 15-minute chart above,near the 4-hour downward trendlineit rises to a point,mBDSR (RCI two-filter) pullback sell signallights up, and subsequently the price declines sharply.
From this example,the high coherence between a higher-timeframe trendline-based trading methodandthe mBDSR signalis evident.
Indicator that shines in combination with RCI【BODSOR・mBDSR】
Methods・Case studies (PDF) ★GogoJungle AWARD2020 winner★
https://www.gogojungle.co.jp/tools/indicators/11836
301 PDF files are included.
Many of them aresummaries of examples that logically link the higher-timeframe and lower-timeframe using the RCI three-line setup, systematically considering the conditions on multiple lower timeframes, and ultimately waiting for a timing to buy on dips or sell on retracements (i.e., mBDSR signals)..
Also,many focus on capturing points where multiple entry justifications overlapas well.
In the explanations,are used.

Methods・Case studies (PDF) ★GogoJungle AWARD2020 winner★
https://www.gogojungle.co.jp/tools/indicators/11836
This product includes 301 PDFs (methods, case studies, etc.). For a list of the PDF titles, please see the article below.
About the 301 PDF files included with 【BODSOR・mBDSR】
https://www.gogojungle.co.jp/finance/navi/articles/34271
Swiss Franc Yen CHFJPY 4-hour chart
Looking at the area circled in white on the 4-hour chart above,a descending trendlineappears to have been reached. It may not be unusual to consider a slight pullback for a while. We will look for signs of selling on the lower timeframes.
Also, considering the possibility of a decline that would update the low from here, we will be mindful ofa double topas shown in the upper chart.
Swiss Franc Yen CHFJPY 15-minute chart
In the 15-minute chart above,near the 4-hour downward trendlineit rises to a point,mBDSR (RCI two-filter) pullback sell signallights up, and subsequently the price declines sharply.
From this example,the high coherence between a higher-timeframe trendline-based trading methodandthe mBDSR signalis evident.
Indicator that shines in combination with RCI【BODSOR・mBDSR】
Methods・Case studies (PDF) ★GogoJungle AWARD2020 winner★
https://www.gogojungle.co.jp/tools/indicators/11836
301 PDF files are included.
Many of them aresummaries of examples that logically link the higher-timeframe and lower-timeframe using the RCI three-line setup, systematically considering the conditions on multiple lower timeframes, and ultimately waiting for a timing to buy on dips or sell on retracements (i.e., mBDSR signals)..
Also,many focus on capturing points where multiple entry justifications overlapas well.
In the explanations,are used.
× ![]()


