

Recent high and the return-sell signal of mBDSR (RCI two-filter) – strongly mindful of a double top –
Indicator that captures "turning points and reversals" with RCI combination【mBDSR】
Methods and Case Studies (PDF) ★GogoJungle AWARD2020 winner★
https://www.gogojungle.co.jp/tools/indicators/11836
The above products include 301 PDFs (methods, case studies, etc.). For a list of the PDF titles, please refer to the article below.
About the 301 attached PDFs for 【BODSOR・mBDSR】
https://www.gogojungle.co.jp/finance/navi/articles/34271
CADJPY (Canadian Dollar/JPY) 4-hour chart
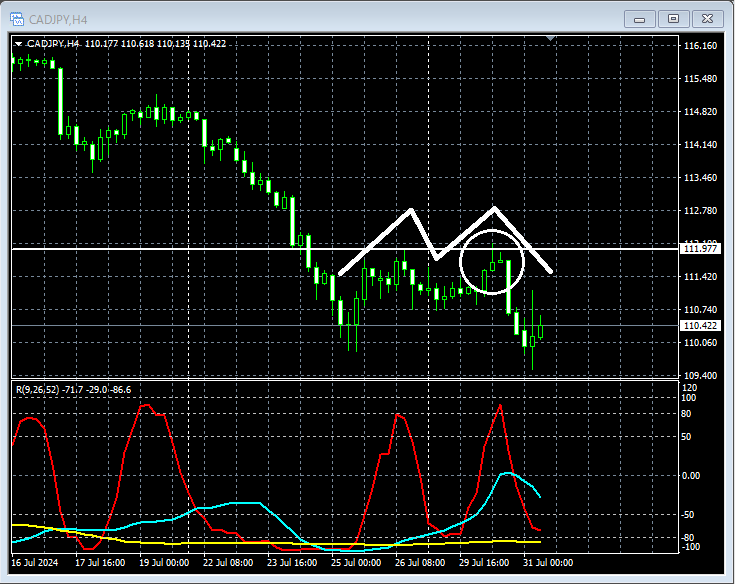
Looking at the area enclosed by the white circle on the above 4-hour chart,the recent highhas risen close to the vicinity. It may not be unreasonable to expect a short-term pullback. We will look for signs of a downturn on lower timeframes.
Also, considering the possibility that a new low may be formed from here, we will be mindful of adouble topas shown in the upper chart.
CADJPY 5-minute chart
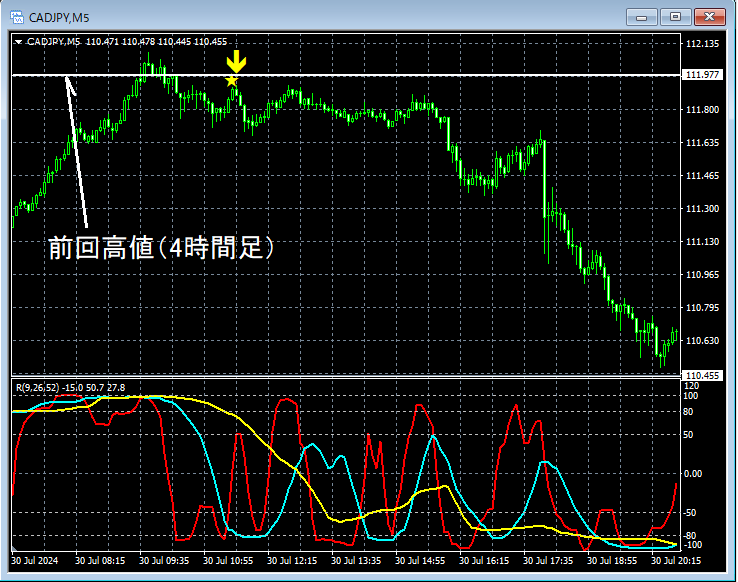
On the above 5-minute chart,near the recent high on the 4-hour chartit rises to around theremBDSR (RCI two-filter) sell signallights up, and subsequently the price declines sharply.
From this example,a trading method focusing on recent highs and double topsandthe signals of mBDSRshow a strong compatibility.
Additionally, in this example, by placing the SL (stop loss) slightly above the recent high on the 5-minute chart,a high risk-reward trade is possible.
Reference: CADJPY 15-minute chart
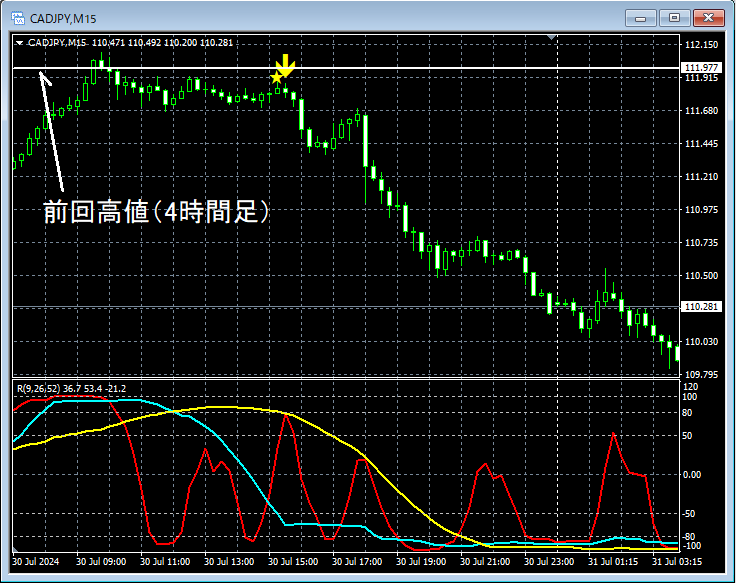
For reference, on the above 15-minute chart, about four hours after the 5-minute chart signaled a pullback,the mBDSR (RCI two-filter) pullback signalappears.
The indicator 【BODSOR・mBDSR】 that delivers power in combination with RCI
Methods and Case Studies (PDF) ★GogoJungle AWARD2020 winner★
https://www.gogojungle.co.jp/tools/indicators/11836
The PDF files amount to 301 in total.
Most of them are compiled as examples that logically link higher and lower timeframes using three RCI lines, sequentially considering the situations of multiple lower timeframes, and finally waiting for the timing to buy on dips or sell on rallies on lower timeframes (i.e., the mBDSR signals).Additionally,
many of them emphasize identifying points where multiple entry reasons overlap..
The explanations useover 1,000 charts in total..

Methods and Case Studies (PDF) ★GogoJungle AWARD2020 winner★
https://www.gogojungle.co.jp/tools/indicators/11836
The above products include 301 PDFs (methods, case studies, etc.). For a list of the PDF titles, please refer to the article below.
About the 301 attached PDFs for 【BODSOR・mBDSR】
https://www.gogojungle.co.jp/finance/navi/articles/34271
CADJPY (Canadian Dollar/JPY) 4-hour chart
Looking at the area enclosed by the white circle on the above 4-hour chart,the recent highhas risen close to the vicinity. It may not be unreasonable to expect a short-term pullback. We will look for signs of a downturn on lower timeframes.
Also, considering the possibility that a new low may be formed from here, we will be mindful of adouble topas shown in the upper chart.
CADJPY 5-minute chart
On the above 5-minute chart,near the recent high on the 4-hour chartit rises to around theremBDSR (RCI two-filter) sell signallights up, and subsequently the price declines sharply.
From this example,a trading method focusing on recent highs and double topsandthe signals of mBDSRshow a strong compatibility.
Additionally, in this example, by placing the SL (stop loss) slightly above the recent high on the 5-minute chart,a high risk-reward trade is possible.
Reference: CADJPY 15-minute chart
For reference, on the above 15-minute chart, about four hours after the 5-minute chart signaled a pullback,the mBDSR (RCI two-filter) pullback signalappears.
The indicator 【BODSOR・mBDSR】 that delivers power in combination with RCI
Methods and Case Studies (PDF) ★GogoJungle AWARD2020 winner★
https://www.gogojungle.co.jp/tools/indicators/11836
The PDF files amount to 301 in total.
Most of them are compiled as examples that logically link higher and lower timeframes using three RCI lines, sequentially considering the situations of multiple lower timeframes, and finally waiting for the timing to buy on dips or sell on rallies on lower timeframes (i.e., the mBDSR signals).Additionally,
many of them emphasize identifying points where multiple entry reasons overlap..
The explanations useover 1,000 charts in total..
× ![]()


