

[Dollar/Yen Strategy] Targeting a pullback sell at the neckline of the double top!! Signal of mBDSR (RCI two-filter) from yesterday's chart (July 30, 2024)
0
Indicator for Catching Tops/Bottoms and Reversals in Combination with RCI: 【mBDSR】
Methods, Case Studies (PDF) ★GogoJungle AWARD2020 Winner★
https://www.gogojungle.co.jp/tools/indicators/11836
The above products include 301 PDF files. For a list of the titles of those PDFs, please see the article below.
About the 301 PDF files included with 【BODSOR・mBDSR】
https://www.gogojungle.co.jp/finance/navi/articles/34271
USD/JPY 15-minute chart
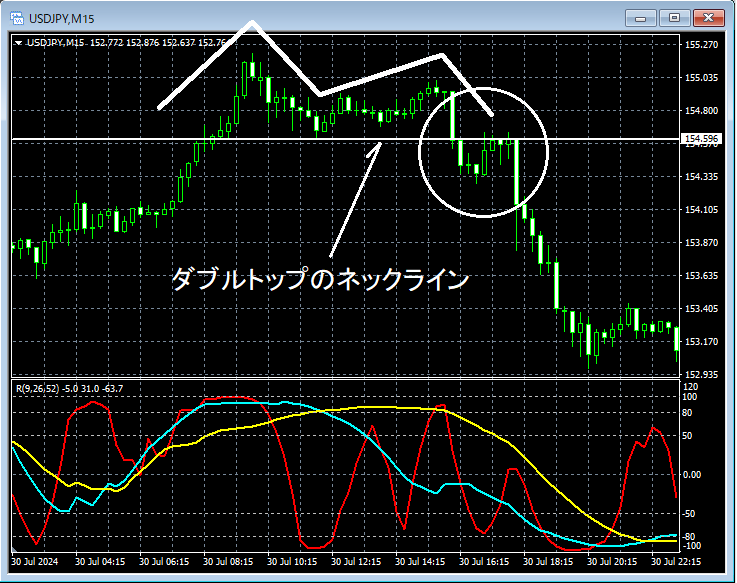
Looking at the area circled in white on the above 15-minute chart,the neckline of the double tophas been broken to the downside. We will examine it in more detail on lower timeframes.
USD/JPY 5-minute chart
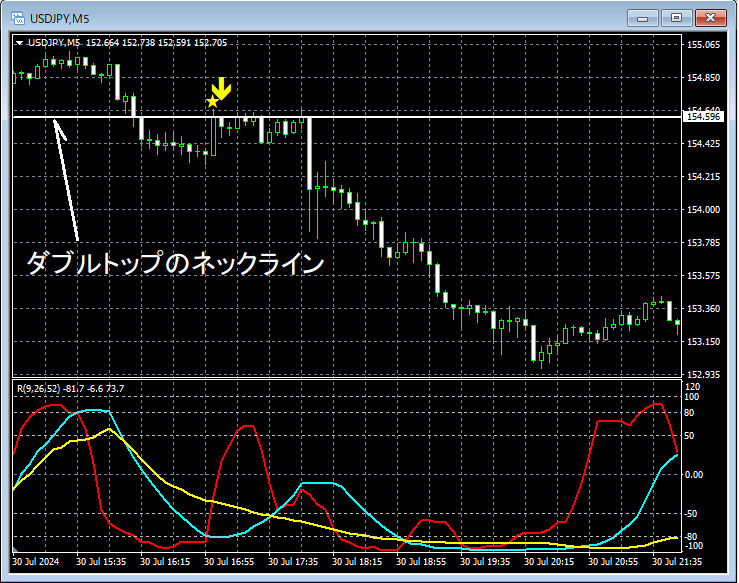
On the above 5-minute chart,the neckline of the double topwas broken to the downside, and when it rose back toward the neckline areamBDSR (Filter: RCI26 and RCI52) overbought/sell signallit up, and afterwards the price declined firmly.
From this example,the trading method focusing on the neckline of the double topandthe signals of mBDSRshow a high degree of compatibility.
A powerful indicator in combination with RCI: 【BODSOR・mBDSR】
Methods, Case Studies (PDF) ★GogoJungle AWARD2020 Winner★
https://www.gogojungle.co.jp/tools/indicators/11836
The PDF files amount to 301 files (over 1,000 pages in total, over 350,000 characters in total).
Many of them are examples that sum up how to logically link higher and lower timeframes using the three RCI lines, sequentially considering multiple lower-timeframe conditions, and ultimately waiting for a pullback buy or a retracement sell timing (i.e., a signal from mBDSR) on the lower timeframe.
Additionally,many of them focus on capturing points where multiple entry reasons overlap.There are many such examples.
In the explanations,over 1,000 chart imagesare used.

Methods, Case Studies (PDF) ★GogoJungle AWARD2020 Winner★
https://www.gogojungle.co.jp/tools/indicators/11836
The above products include 301 PDF files. For a list of the titles of those PDFs, please see the article below.
About the 301 PDF files included with 【BODSOR・mBDSR】
https://www.gogojungle.co.jp/finance/navi/articles/34271
USD/JPY 15-minute chart
Looking at the area circled in white on the above 15-minute chart,the neckline of the double tophas been broken to the downside. We will examine it in more detail on lower timeframes.
USD/JPY 5-minute chart
On the above 5-minute chart,the neckline of the double topwas broken to the downside, and when it rose back toward the neckline areamBDSR (Filter: RCI26 and RCI52) overbought/sell signallit up, and afterwards the price declined firmly.
From this example,the trading method focusing on the neckline of the double topandthe signals of mBDSRshow a high degree of compatibility.
A powerful indicator in combination with RCI: 【BODSOR・mBDSR】
Methods, Case Studies (PDF) ★GogoJungle AWARD2020 Winner★
https://www.gogojungle.co.jp/tools/indicators/11836
The PDF files amount to 301 files (over 1,000 pages in total, over 350,000 characters in total).
Many of them are examples that sum up how to logically link higher and lower timeframes using the three RCI lines, sequentially considering multiple lower-timeframe conditions, and ultimately waiting for a pullback buy or a retracement sell timing (i.e., a signal from mBDSR) on the lower timeframe.
Additionally,many of them focus on capturing points where multiple entry reasons overlap.There are many such examples.
In the explanations,over 1,000 chart imagesare used.
× ![]()


