

[Dollar/Yen Strategy] Targeting the rebound after breaking the recent low!! Sign of mBDSR (RCI 2-filter) from the chart yesterday (July 30, 2024)
0
Indicator that captures “tops and bottoms and reversals” in combination with RCI 【mBDSR】
Methods and Case Studies (PDF) ★GogoJungle AWARD2020 Winner★
https://www.gogojungle.co.jp/tools/indicators/11836
The above products include 301 PDFs. For a list of their PDF titles, please refer to the article below.
About the 301 PDF files accompanying 【BODSOR・mBDSR】
https://www.gogojungle.co.jp/finance/navi/articles/34271
Dollar/Yen 5-minute chart
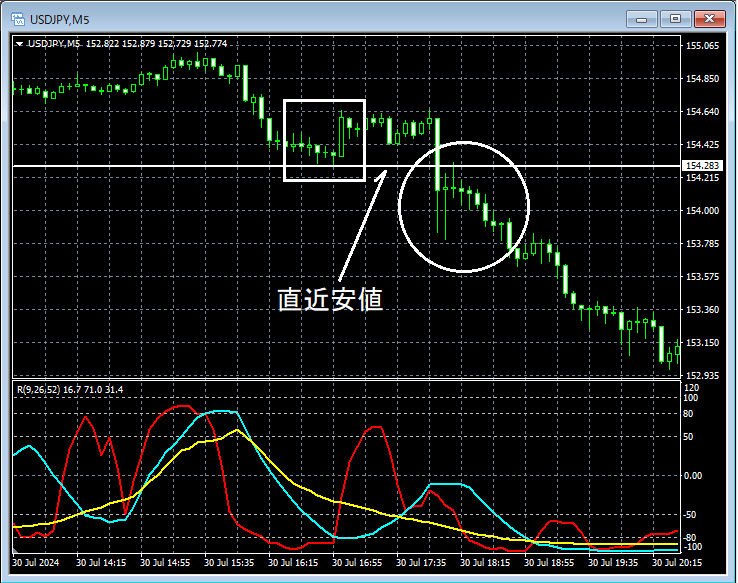
Looking at the area circled in white on the 5-minute chart above,the recent low has been broken below. We will zoom in on the lower timeframes for details.
Dollar/Yen 1-minute chart
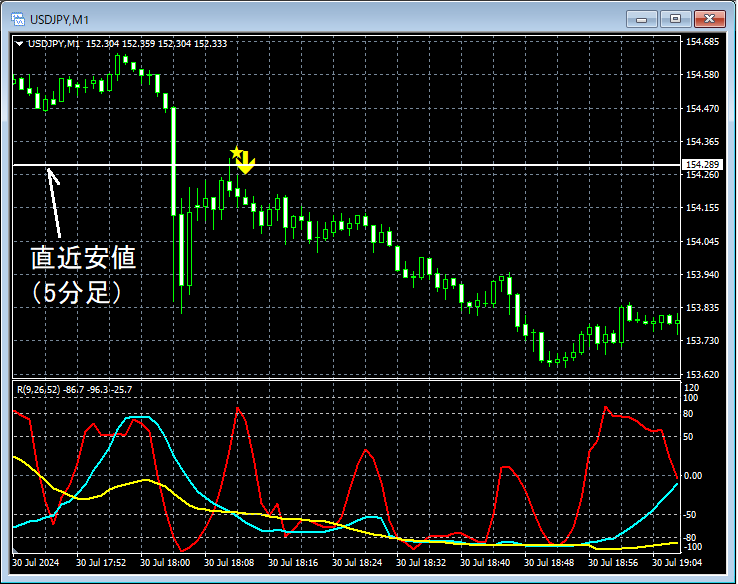
On the 1-minute chart above,the line indicating the recent lowwas broken below, and as it rose toward that vicinity,mBDSR (Filter: RCI26 and RCI52) short signal lit up, and price has since moved firmly downward.
From this example,a trading approach focused on breaking the recent lowandthe synergy with mBDSR signalscan be observed.
Indicator that shines when combined with RCI: 【BODSOR・mBDSR】
Methods and Case Studies (PDF) ★GogoJungle AWARD2020 Winner★
https://www.gogojungle.co.jp/tools/indicators/11836
The PDF files include 301 items (over 1,000 pages, over 350,000 characters in total).
Many of them are aboutusing the three RCI lines to logically link higher and lower timeframes, examining the conditions of multiple lower timeframes one by one, and ultimately waiting for buying on dips or selling on rallies (i.e., mBDSR signals) on the lower timeframe.This is the form that has been compiled.
Additionally,many focus on identifying points where multiple entry reasons overlap..
In the explanationsmore than 1,000 charts are used..

Methods and Case Studies (PDF) ★GogoJungle AWARD2020 Winner★
https://www.gogojungle.co.jp/tools/indicators/11836
The above products include 301 PDFs. For a list of their PDF titles, please refer to the article below.
About the 301 PDF files accompanying 【BODSOR・mBDSR】
https://www.gogojungle.co.jp/finance/navi/articles/34271
Dollar/Yen 5-minute chart
Looking at the area circled in white on the 5-minute chart above,the recent low has been broken below. We will zoom in on the lower timeframes for details.
Dollar/Yen 1-minute chart
On the 1-minute chart above,the line indicating the recent lowwas broken below, and as it rose toward that vicinity,mBDSR (Filter: RCI26 and RCI52) short signal lit up, and price has since moved firmly downward.
From this example,a trading approach focused on breaking the recent lowandthe synergy with mBDSR signalscan be observed.
Indicator that shines when combined with RCI: 【BODSOR・mBDSR】
Methods and Case Studies (PDF) ★GogoJungle AWARD2020 Winner★
https://www.gogojungle.co.jp/tools/indicators/11836
The PDF files include 301 items (over 1,000 pages, over 350,000 characters in total).
Many of them are aboutusing the three RCI lines to logically link higher and lower timeframes, examining the conditions of multiple lower timeframes one by one, and ultimately waiting for buying on dips or selling on rallies (i.e., mBDSR signals) on the lower timeframe.This is the form that has been compiled.
Additionally,many focus on identifying points where multiple entry reasons overlap..
In the explanationsmore than 1,000 charts are used..
× ![]()


