

Recent high and mBDSR (RCI2-bandpass filter) selling signal
0
Indicator that captures “bottoms and reversals” when combined with RCI: 【mBDSR】
Methods and case studies (PDF) ★GogoJungle AWARD2020 winner★
https://www.gogojungle.co.jp/tools/indicators/11836
The above product includes 301 PDFs (methods, case studies, etc.). For the list of PDF titles, please refer to the article below.
Regarding the 301 PDF files included with 【BODSOR・mBDSR】
https://www.gogojungle.co.jp/finance/navi/articles/34271
EUR/JPY 4-hour chart
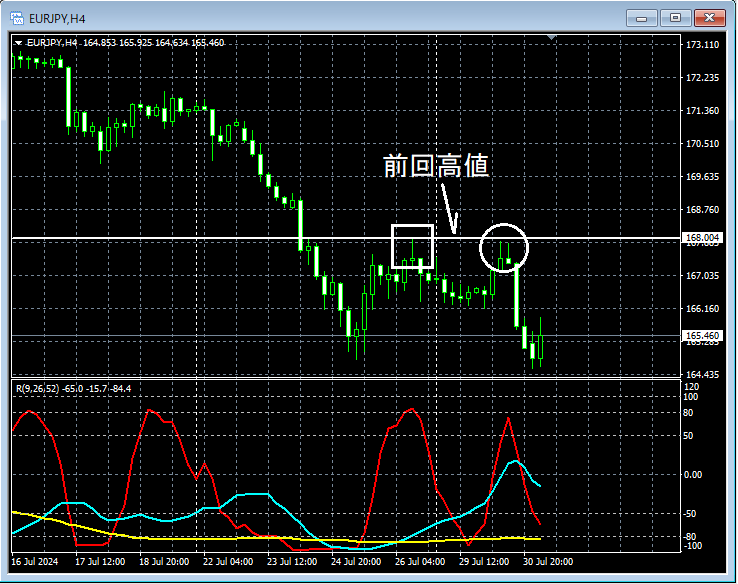
If you look at the area encased in a white circle on the 4-hour chart above,it has risen close to the recent highnearby. It may not be surprising if it temporarily dips a little. We will check for signals of downward movement on lower timeframes.
EUR/JPY 5-minute chart
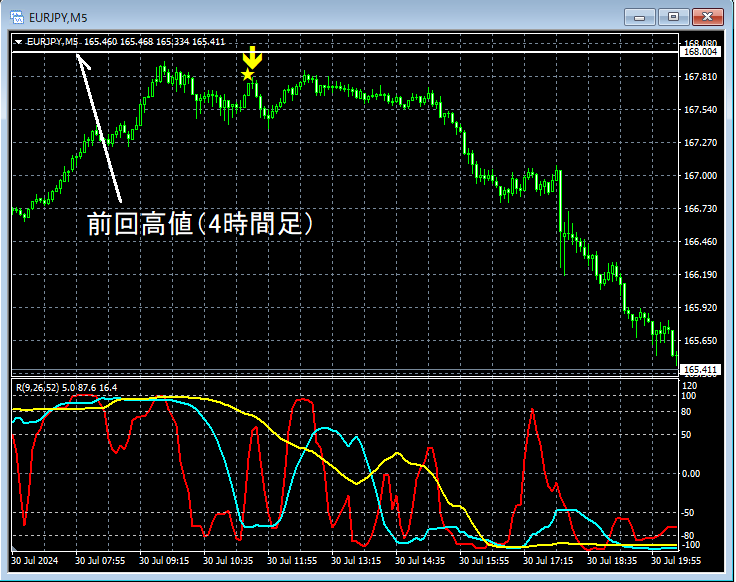
In the above 5-minute chart,it rises toward the vicinity of the recent high on the 4-hour leveland thenmBDSR (two RCI lines) pullback sell signallights up, followed by a sharp price drop.
From this example,a trading method focused on recent highs and double topsandthe signals of mBDSRshow high compatibility.
Additionally, in this example, placing the stop-loss (SL) just above the recent high on the 5-minute chartslightly above the 5-minute highallows for a higher risk-reward trade.
Indicator that shines when combined with RCI: 【BODSOR・mBDSR】
Methods and case studies (PDF) ★GogoJungle AWARD2020 winner★
https://www.gogojungle.co.jp/tools/indicators/11836
The PDFs include 301 files.
Many of them explain a structure where the higher and lower timeframes are logically linked using three RCI lines to examine multiple lower-timeframe conditions sequentially, ultimately waiting for a timing to buy on dips or sell on rallies in the lower timeframe (i.e., signals from mBDSR)..
Additionally,many are focused on identifying points where multiple entry reasons coincide..
Description usesmore than 1,000 charts.

Methods and case studies (PDF) ★GogoJungle AWARD2020 winner★
https://www.gogojungle.co.jp/tools/indicators/11836
The above product includes 301 PDFs (methods, case studies, etc.). For the list of PDF titles, please refer to the article below.
Regarding the 301 PDF files included with 【BODSOR・mBDSR】
https://www.gogojungle.co.jp/finance/navi/articles/34271
EUR/JPY 4-hour chart
If you look at the area encased in a white circle on the 4-hour chart above,it has risen close to the recent highnearby. It may not be surprising if it temporarily dips a little. We will check for signals of downward movement on lower timeframes.
EUR/JPY 5-minute chart
In the above 5-minute chart,it rises toward the vicinity of the recent high on the 4-hour leveland thenmBDSR (two RCI lines) pullback sell signallights up, followed by a sharp price drop.
From this example,a trading method focused on recent highs and double topsandthe signals of mBDSRshow high compatibility.
Additionally, in this example, placing the stop-loss (SL) just above the recent high on the 5-minute chartslightly above the 5-minute highallows for a higher risk-reward trade.
Indicator that shines when combined with RCI: 【BODSOR・mBDSR】
Methods and case studies (PDF) ★GogoJungle AWARD2020 winner★
https://www.gogojungle.co.jp/tools/indicators/11836
The PDFs include 301 files.
Many of them explain a structure where the higher and lower timeframes are logically linked using three RCI lines to examine multiple lower-timeframe conditions sequentially, ultimately waiting for a timing to buy on dips or sell on rallies in the lower timeframe (i.e., signals from mBDSR)..
Additionally,many are focused on identifying points where multiple entry reasons coincide..
Description usesmore than 1,000 charts.
× ![]()


