

Pin bar on the upper foot and return-sell signal of mBDSR (RCI 2-filter & MA 2-filter)
0
Indicator 【mBDSR】 that captures the bottom and reversal with RCI combination
and its methods / case studies (PDF) ★GogoJungle AWARD2020 winner★
https://www.gogojungle.co.jp/tools/indicators/11836
The above products include 301 PDFs. For a list of their PDF titles, please see the article below.
About the 301 PDF files included with 【BODSOR・mBDSR】
https://www.gogojungle.co.jp/finance/navi/articles/34271
mBDSR (RCI filter)andmBDSR (Moving Average filter)have different roles. The above PDFs also discuss how to use them appropriately.
Below,mBDSR (RCI filter)andmBDSR (Moving Average filter)will be shown with examples of both signals.
AUDJPY (Australian Dollar/Yen) 4-hour chart
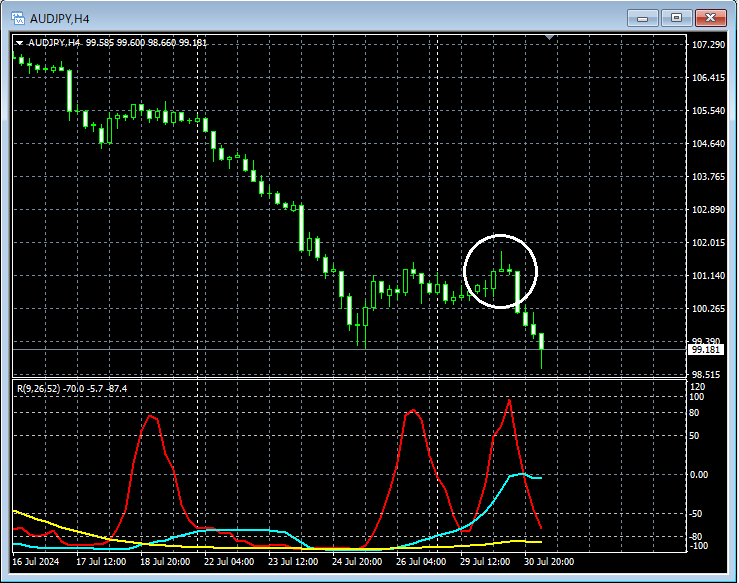
In the 4-hour chart, around the area circled in white, there is a signal suggesting a downward movePin bar (long upper wick candle)appearing. It may not be strange to consider selling on pullbacks on lower timeframes.
AUDJPY 15-minute chart
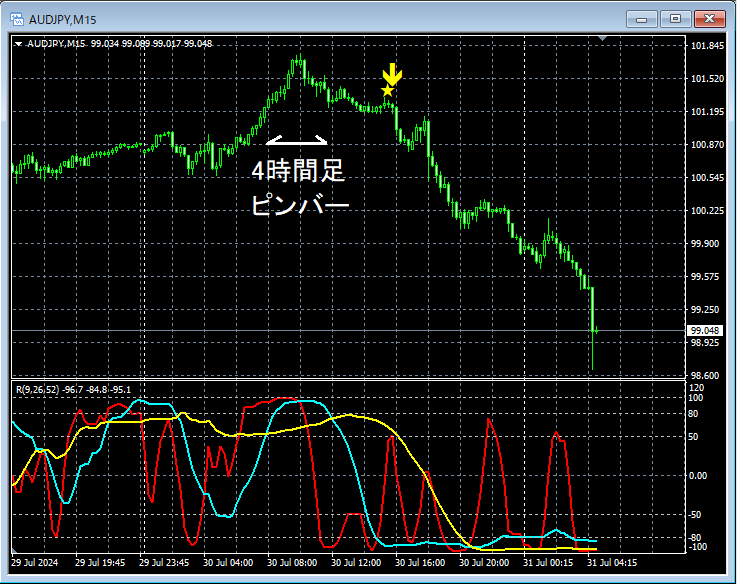
On the 15-minute chart above, after apin bar (long upper wick candle)that suggests a decline on the 4-hour chart appeared,mBDSR (two RCI filters) sell signallit up and prices dropped significantly.
From this example,a high compatibility between a trade method focused on Pin Bars (long upper wick candles)andthe signals of mBDSRis evident.
Reference: AUDJPY 15-minute chart
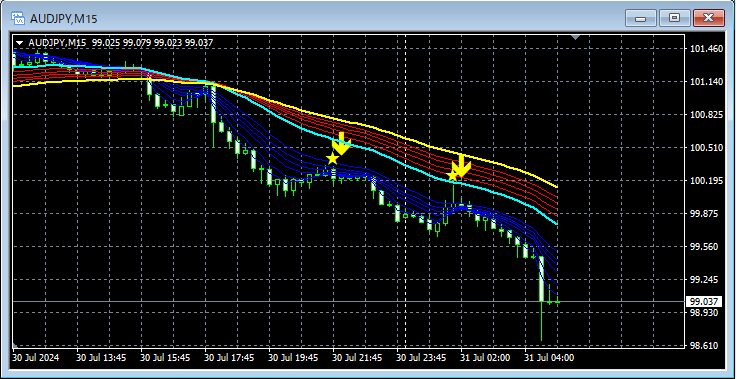
In the 15-minute chart above, themBDSR (two RCI filter) sell signalappears in the decline period, and themBDSR (MA two-filter)signal is shown. It is clear that the timing of the pullback selling is well captured.
Indicator that shines when combined with RCI: 【BODSOR・mBDSR】
and its methods / case studies (PDF) ★GogoJungle AWARD2020 winner★
https://www.gogojungle.co.jp/tools/indicators/11836
The PDFs include 301 files (over 1,000 pages in total, over 350,000 characters).
Many of them areexamples that break down the way to logically link higher and lower timeframes using three RCI lines, sequentially considering the conditions of multiple lower timeframes, and ultimately waiting for pullback buying or selling timing (i.e., mBDSR signals) on the lower timeframes..
Also,many focus on pinpointing points where multiple entry reasons coincide..
The description usesmore than 1,000 charts.

and its methods / case studies (PDF) ★GogoJungle AWARD2020 winner★
https://www.gogojungle.co.jp/tools/indicators/11836
The above products include 301 PDFs. For a list of their PDF titles, please see the article below.
About the 301 PDF files included with 【BODSOR・mBDSR】
https://www.gogojungle.co.jp/finance/navi/articles/34271
mBDSR (RCI filter)andmBDSR (Moving Average filter)have different roles. The above PDFs also discuss how to use them appropriately.
Below,mBDSR (RCI filter)andmBDSR (Moving Average filter)will be shown with examples of both signals.
AUDJPY (Australian Dollar/Yen) 4-hour chart
In the 4-hour chart, around the area circled in white, there is a signal suggesting a downward movePin bar (long upper wick candle)appearing. It may not be strange to consider selling on pullbacks on lower timeframes.
AUDJPY 15-minute chart
On the 15-minute chart above, after apin bar (long upper wick candle)that suggests a decline on the 4-hour chart appeared,mBDSR (two RCI filters) sell signallit up and prices dropped significantly.
From this example,a high compatibility between a trade method focused on Pin Bars (long upper wick candles)andthe signals of mBDSRis evident.
Reference: AUDJPY 15-minute chart
In the 15-minute chart above, themBDSR (two RCI filter) sell signalappears in the decline period, and themBDSR (MA two-filter)signal is shown. It is clear that the timing of the pullback selling is well captured.
Indicator that shines when combined with RCI: 【BODSOR・mBDSR】
and its methods / case studies (PDF) ★GogoJungle AWARD2020 winner★
https://www.gogojungle.co.jp/tools/indicators/11836
The PDFs include 301 files (over 1,000 pages in total, over 350,000 characters).
Many of them areexamples that break down the way to logically link higher and lower timeframes using three RCI lines, sequentially considering the conditions of multiple lower timeframes, and ultimately waiting for pullback buying or selling timing (i.e., mBDSR signals) on the lower timeframes..
Also,many focus on pinpointing points where multiple entry reasons coincide..
The description usesmore than 1,000 charts.
× ![]()


