

[Today’s USD/JPY攻略] Sakata Five Methods "Evening Star" combined with moving average lines, and three-line RCI with R1R2S2 rebound sell signal July 30, 2024
0
Indicator that captures the bottom and reversal in combination with RCI【mBDSR】
Methods and Case Studies (PDF) ★GogoJungle AWARD2020 Winner★
https://www.gogojungle.co.jp/tools/indicators/11836
The above products include 301 PDFs (methods, case studies, etc.). For a list of the PDF titles, please see the article below.
About the 301 PDF files included with 【BODSOR・mBDSR】
https://www.gogojungle.co.jp/finance/navi/articles/34271
R1R2S2 is included in the above product. For details, please see the article below in Investment Navi+.
RCI three-line indicator “R1R2S2” release to target trend reversals, pullbacks, and pullbacks!!
USDJPY 5-minute chart
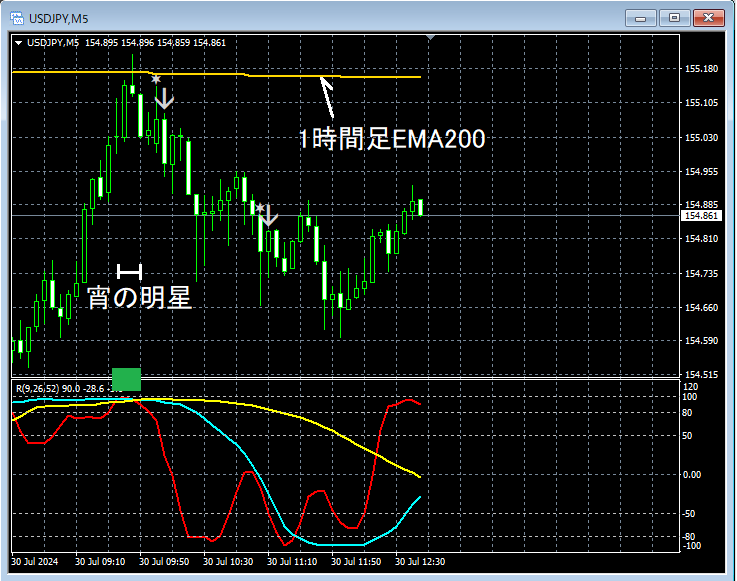
If you look at the 5-minute chart above, it often acts as resistanceNear the 1-hour EMA200when it rises close to it, it suggests a potential decreaseIn the Sakata method’s “Evening Star”appears, and at this timingRCI three-lineis in a so-calledTriple-top RCIformation. From this, it can be said that a downside reversal is not surprising here.
And as you monitor the chart progression,R1R2S2sells signal lights up, and afterward the price clearly moves down.
From this example,the trading method focusing on the Sakata method’s “Evening Star,” moving averages, and the RCI three-linefeatures a strong compatibility withthe R1R2S2 signals.
Indicator that excels in combination with RCI【BODSOR・mBDSR】
Methods and Case Studies (PDF) ★GogoJungle AWARD2020 Winner★
https://www.gogojungle.co.jp/tools/indicators/11836
The PDF files are 301 in total.
Many of them are focused on logically linking higher and lower timeframes using the RCI three-line, sequentially considering multiple lower timeframe conditions, and ultimately waiting for pullbacks or pullback timing on the lower timeframes (i.e., mBDSR signals).They are compiled examples of this approach.
Additionally,many of them emphasize identifying points where multiple entry reasons overlap.
In the explanations,over 1,000 chartsare used.

Methods and Case Studies (PDF) ★GogoJungle AWARD2020 Winner★
https://www.gogojungle.co.jp/tools/indicators/11836
The above products include 301 PDFs (methods, case studies, etc.). For a list of the PDF titles, please see the article below.
About the 301 PDF files included with 【BODSOR・mBDSR】
https://www.gogojungle.co.jp/finance/navi/articles/34271
R1R2S2 is included in the above product. For details, please see the article below in Investment Navi+.
RCI three-line indicator “R1R2S2” release to target trend reversals, pullbacks, and pullbacks!!
USDJPY 5-minute chart
If you look at the 5-minute chart above, it often acts as resistanceNear the 1-hour EMA200when it rises close to it, it suggests a potential decreaseIn the Sakata method’s “Evening Star”appears, and at this timingRCI three-lineis in a so-calledTriple-top RCIformation. From this, it can be said that a downside reversal is not surprising here.
And as you monitor the chart progression,R1R2S2sells signal lights up, and afterward the price clearly moves down.
From this example,the trading method focusing on the Sakata method’s “Evening Star,” moving averages, and the RCI three-linefeatures a strong compatibility withthe R1R2S2 signals.
Indicator that excels in combination with RCI【BODSOR・mBDSR】
Methods and Case Studies (PDF) ★GogoJungle AWARD2020 Winner★
https://www.gogojungle.co.jp/tools/indicators/11836
The PDF files are 301 in total.
Many of them are focused on logically linking higher and lower timeframes using the RCI three-line, sequentially considering multiple lower timeframe conditions, and ultimately waiting for pullbacks or pullback timing on the lower timeframes (i.e., mBDSR signals).They are compiled examples of this approach.
Additionally,many of them emphasize identifying points where multiple entry reasons overlap.
In the explanations,over 1,000 chartsare used.
× ![]()


