

The five methods of Sakata: "Morning Star" and mBDSR's first-buy signal (2)
0
Indicator that captures the tops and bottoms with the combination of RCI: 【mBDSR】
Method and Case Studies (PDF) ★GogoJungle AWARD2020 Winner★
https://www.gogojungle.co.jp/tools/indicators/11836
The above product includes 301 PDFs (methods, case studies, etc.). For a list of the PDF titles, please refer to the article below.
Regarding the 301 PDF files included with 【BODSOR・mBDSR】
https://www.gogojungle.co.jp/finance/navi/articles/34271
AUDUSD 15-minute chart
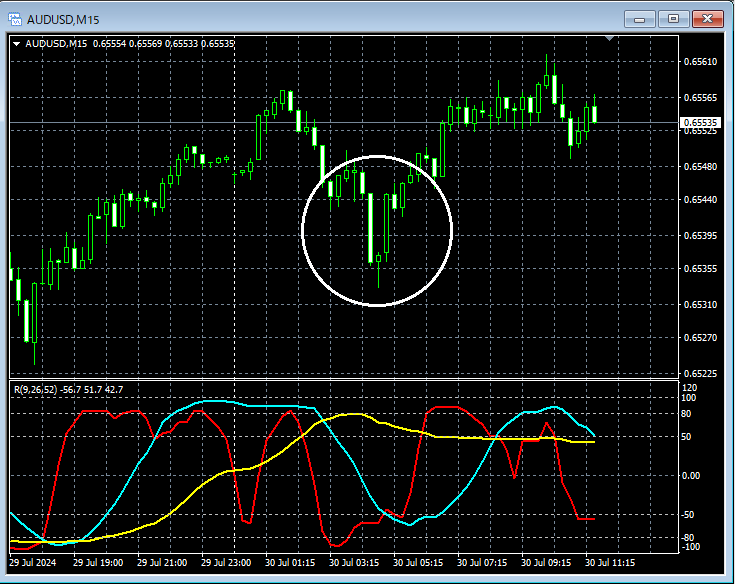
If you look at the area circled in white on the 15-minute chart abovethe "Morning Star" in Japanese candlestick patternappears. This candlestick pattern suggests a bullish reversal, and it might not be unusual to consider buying on pullbacks in a lower timeframe.
AUDUSD 5-minute chart
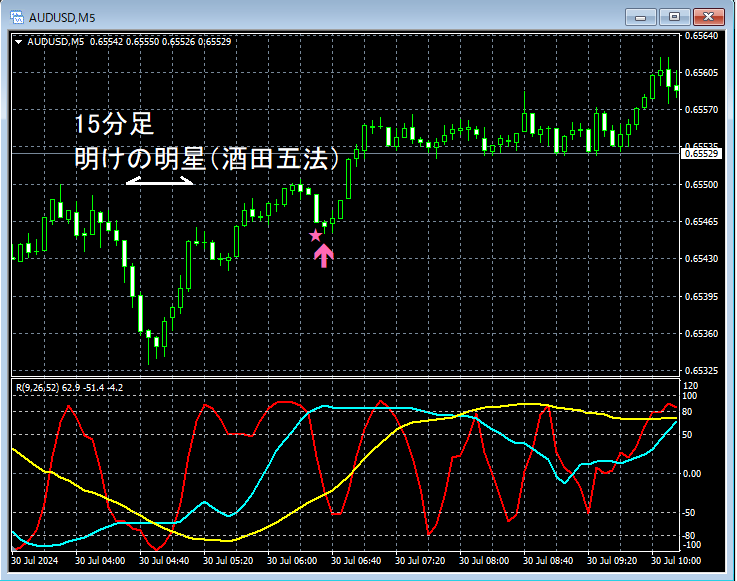
On the higher time frame of 15 minutes,the "Morning Star" in Japanese candlestick patternappears, and on the higher 5-minute chart,the mBDSR (two-RCI filters) pullback buy signallights up and rises smoothly.
From this example,a trading method focused on the "Morning Star" in the Japanese candlestick patternandthe signals of mBDSRshow a strong compatibility.
An indicator that shines when combined with RCI【BODSOR・mBDSR】
Method and Case Studies (PDF) ★GogoJungle AWARD2020 Winner★
https://www.gogojungle.co.jp/tools/indicators/11836
301 PDF files are included.
Many of them explain the process of linking higher and lower timeframes logically using three RCI lines, progressively considering the conditions on multiple lower timeframes, and ultimately waiting for pullbacks or retracements on the lower timeframes (i.e., the mBDSR signals)..
Also,many focus on identifying points where multiple entry reasons coincide.There are many such examples.
The explanations useover 1,000 charts in total..

Method and Case Studies (PDF) ★GogoJungle AWARD2020 Winner★
https://www.gogojungle.co.jp/tools/indicators/11836
The above product includes 301 PDFs (methods, case studies, etc.). For a list of the PDF titles, please refer to the article below.
Regarding the 301 PDF files included with 【BODSOR・mBDSR】
https://www.gogojungle.co.jp/finance/navi/articles/34271
AUDUSD 15-minute chart
If you look at the area circled in white on the 15-minute chart abovethe "Morning Star" in Japanese candlestick patternappears. This candlestick pattern suggests a bullish reversal, and it might not be unusual to consider buying on pullbacks in a lower timeframe.
AUDUSD 5-minute chart
On the higher time frame of 15 minutes,the "Morning Star" in Japanese candlestick patternappears, and on the higher 5-minute chart,the mBDSR (two-RCI filters) pullback buy signallights up and rises smoothly.
From this example,a trading method focused on the "Morning Star" in the Japanese candlestick patternandthe signals of mBDSRshow a strong compatibility.
An indicator that shines when combined with RCI【BODSOR・mBDSR】
Method and Case Studies (PDF) ★GogoJungle AWARD2020 Winner★
https://www.gogojungle.co.jp/tools/indicators/11836
301 PDF files are included.
Many of them explain the process of linking higher and lower timeframes logically using three RCI lines, progressively considering the conditions on multiple lower timeframes, and ultimately waiting for pullbacks or retracements on the lower timeframes (i.e., the mBDSR signals)..
Also,many focus on identifying points where multiple entry reasons coincide.There are many such examples.
The explanations useover 1,000 charts in total..
× ![]()


