

Sakata Five Methods “Morning Star” and mBDSR’s Buy Signal (1)
Indicator that captures “bottoms and reversals” in combination with RCI【mBDSR】
Methods and Case Studies (PDF) ★GogoJungle AWARD2020 Winner★
https://www.gogojungle.co.jp/tools/indicators/11836
The above products include 301 PDFs (such as methods and case studies). For a list of the titles of these PDFs, please refer to the article below.
About the 301 PDF files included with 【BODSOR・mBDSR】
https://www.gogojungle.co.jp/finance/navi/articles/34271
Australia Swiss AUDCHF 15-minute chart
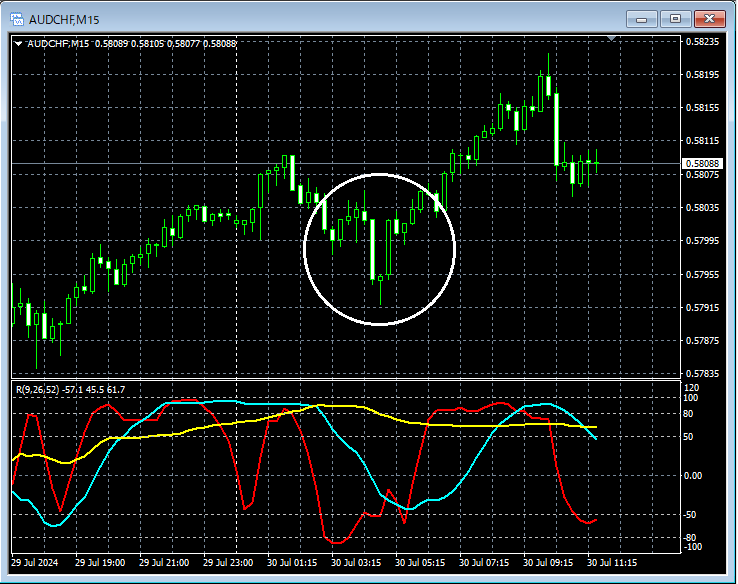
If you look at the area circled with a white circle on the 15-minute chart aboveSakata Five Methods “Morning Star”appears. This candlestick pattern suggests a bullish reversal, and it might be reasonable to consider buying on dips on a lower timeframe.
Australia Swiss AUDCHF 5-minute chart
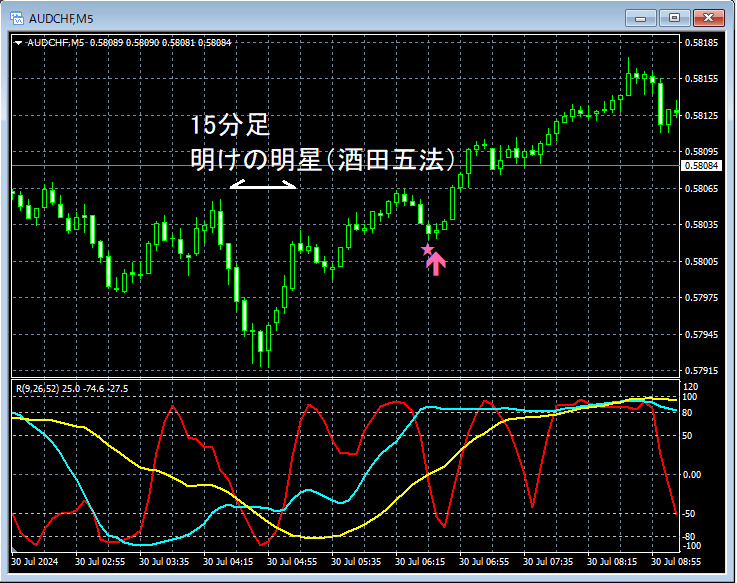
On the higher 15-minute timeframeSakata Five Methods “Morning Star”appears, and on the upper 5-minute chartmBDSR (RCI two-filter) Buy-the-Dip signallights up and rises smoothly.
From this example,a trading approach focusing on Sakata Five Methods “Morning Star”andthe signals of mBDSRshowing high compatibility.
Indicator that shines when combined with RCI: 【BODSOR・mBDSR】
Methods and Case Studies (PDF) ★GogoJungle AWARD2020 Winner★
https://www.gogojungle.co.jp/tools/indicators/11836
301 PDF files are included.
Most of them are compiled as examples that logically link higher and lower timeframes using three RCI lines, sequentially examining multiple lower timeframes, and ultimately waiting for a dip buy or pullback sell timing (i.e., mBDSR signals) on the lower timeframes.They also place emphasis on identifying points where multiple entry reasons overlap.
In the explanations,over 1,000 charts are used.

Methods and Case Studies (PDF) ★GogoJungle AWARD2020 Winner★
https://www.gogojungle.co.jp/tools/indicators/11836
The above products include 301 PDFs (such as methods and case studies). For a list of the titles of these PDFs, please refer to the article below.
About the 301 PDF files included with 【BODSOR・mBDSR】
https://www.gogojungle.co.jp/finance/navi/articles/34271
Australia Swiss AUDCHF 15-minute chart
If you look at the area circled with a white circle on the 15-minute chart aboveSakata Five Methods “Morning Star”appears. This candlestick pattern suggests a bullish reversal, and it might be reasonable to consider buying on dips on a lower timeframe.
Australia Swiss AUDCHF 5-minute chart
On the higher 15-minute timeframeSakata Five Methods “Morning Star”appears, and on the upper 5-minute chartmBDSR (RCI two-filter) Buy-the-Dip signallights up and rises smoothly.
From this example,a trading approach focusing on Sakata Five Methods “Morning Star”andthe signals of mBDSRshowing high compatibility.
Indicator that shines when combined with RCI: 【BODSOR・mBDSR】
Methods and Case Studies (PDF) ★GogoJungle AWARD2020 Winner★
https://www.gogojungle.co.jp/tools/indicators/11836
301 PDF files are included.
Most of them are compiled as examples that logically link higher and lower timeframes using three RCI lines, sequentially examining multiple lower timeframes, and ultimately waiting for a dip buy or pullback sell timing (i.e., mBDSR signals) on the lower timeframes.They also place emphasis on identifying points where multiple entry reasons overlap.
In the explanations,over 1,000 charts are used.
× ![]()


