

The Five Methods of Sakata: "Evening Star" and mBDSR’s return-sell signal (2)
0
Indicator that captures bottoms, tops, and reversals in combination with RCI: 【mBDSR】
Methods and Case Studies (PDF) ★GogoJungle AWARD2020 Winner★
https://www.gogojungle.co.jp/tools/indicators/11836
The above products include 301 PDFs (methods, case studies, etc.). For a list of the titles of those PDFs, please refer to the article below.
Regarding the 301 PDF files included with 【BODSOR・mBDSR】
https://www.gogojungle.co.jp/finance/navi/articles/34271
Euro/Oz: EURAUD 15-minute chart
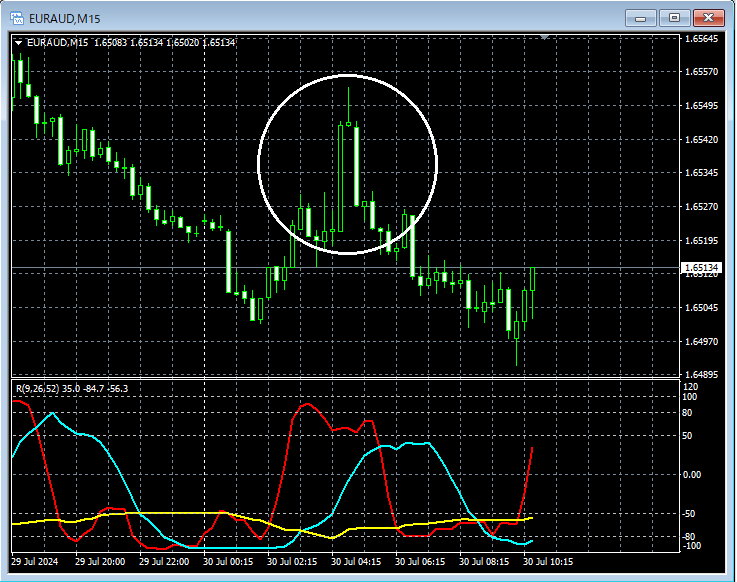
When you look at the 15-minute chart above, within the white circlethe “Evening Star” from the Sankata goho (Five Methods)appears. This candlestick pattern suggests a potential downturn, and it may not be strange to consider selling on retracements on lower time frames.
Euro/Oz: EURAUD 5-minute chart
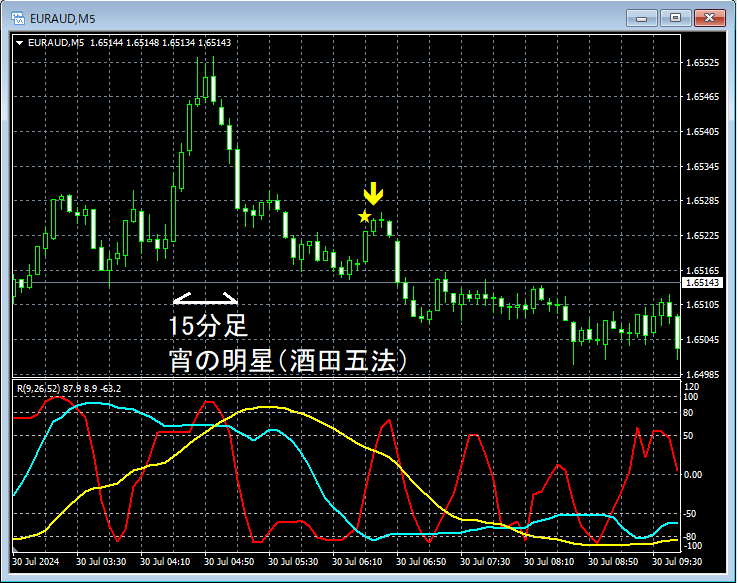
On the higher time frame of the 15-minute chart,the Sankata goho “Evening Star”appears, after which on the upper 5-minute chartthe mBDSR (RCI two-filter) short exit signallights up and continues to fall smoothly.
From this example,there is a strong compatibility between the trading method focused on the Sankata goho “Evening Star”andthe signals of mBDSR.
The indicator 【BODSOR・mBDSR】 that delivers power in combination with RCI
Methods and Case Studies (PDF) ★GogoJungle AWARD2020 Winner★
https://www.gogojungle.co.jp/tools/indicators/11836
The PDF files included are 301 in total.
Many of them are summaries of examples that link the higher and lower time frames logically using three RCI lines, examining multiple lower-time-frame situations sequentially, and ultimately waiting for the timing of a bottom-buy or pullback sell (i.e., the signals of mBDSR) on the lower time frames.Additionally,
there are many that emphasize identifying points where multiple entry reasons overlap..
In the explanations,over 1,000 chartsare used.

Methods and Case Studies (PDF) ★GogoJungle AWARD2020 Winner★
https://www.gogojungle.co.jp/tools/indicators/11836
The above products include 301 PDFs (methods, case studies, etc.). For a list of the titles of those PDFs, please refer to the article below.
Regarding the 301 PDF files included with 【BODSOR・mBDSR】
https://www.gogojungle.co.jp/finance/navi/articles/34271
Euro/Oz: EURAUD 15-minute chart
When you look at the 15-minute chart above, within the white circlethe “Evening Star” from the Sankata goho (Five Methods)appears. This candlestick pattern suggests a potential downturn, and it may not be strange to consider selling on retracements on lower time frames.
Euro/Oz: EURAUD 5-minute chart
On the higher time frame of the 15-minute chart,the Sankata goho “Evening Star”appears, after which on the upper 5-minute chartthe mBDSR (RCI two-filter) short exit signallights up and continues to fall smoothly.
From this example,there is a strong compatibility between the trading method focused on the Sankata goho “Evening Star”andthe signals of mBDSR.
The indicator 【BODSOR・mBDSR】 that delivers power in combination with RCI
Methods and Case Studies (PDF) ★GogoJungle AWARD2020 Winner★
https://www.gogojungle.co.jp/tools/indicators/11836
The PDF files included are 301 in total.
Many of them are summaries of examples that link the higher and lower time frames logically using three RCI lines, examining multiple lower-time-frame situations sequentially, and ultimately waiting for the timing of a bottom-buy or pullback sell (i.e., the signals of mBDSR) on the lower time frames.Additionally,
there are many that emphasize identifying points where multiple entry reasons overlap..
In the explanations,over 1,000 chartsare used.
× ![]()


