

Shogatagōhō "Shō no Myōjō" and mBDSR return-sale signal (1)
Indicator that captures “the bottom and reversal” in combination with RCI【mBDSR】
and methods / case studies (PDF) ★GogoJungle AWARD2020 winner★
https://www.gogojungle.co.jp/tools/indicators/11836
The above product includes 301 PDFs (methods, case studies, etc.). For a list of the titles of these PDFs, please see the article below.
About the 301 PDF files included with 【BODSOR・mBDSR】
https://www.gogojungle.co.jp/finance/navi/articles/34271
Pound Aussie GBPAUD 15-minute chart
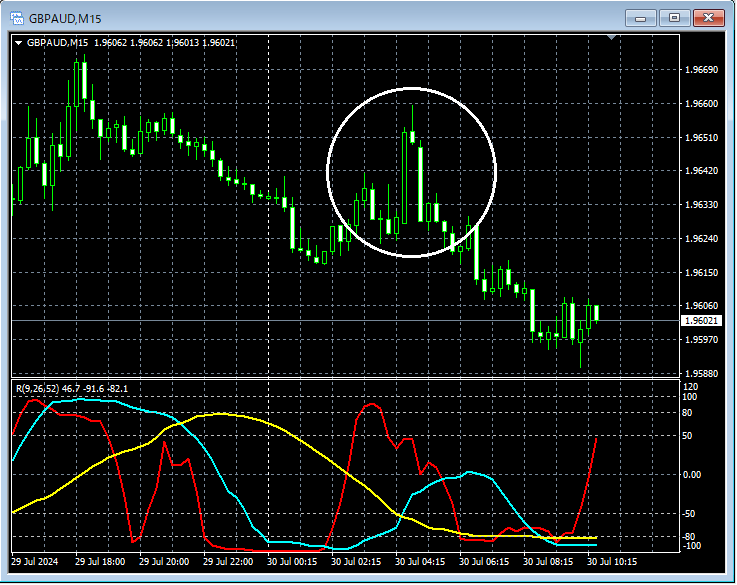
Looking at the area circled with a white circle on the 15-minute chart above,the Lasen's “Evening Star”appears. This candlestick pattern suggests a bearish reversal, and it may not be unusual to consider selling on pullbacks on a lower time frame.
Pound Aussie GBPAUD 5-minute chart
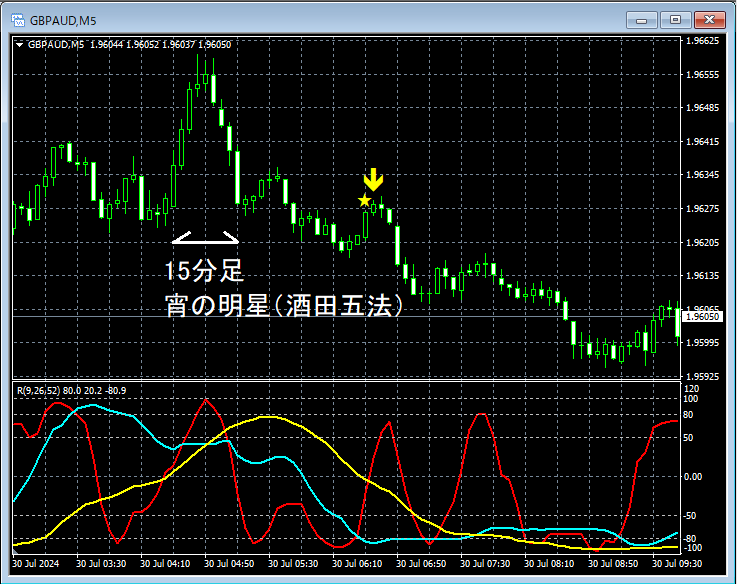
On the higher-time frame 15-minute chart,the Lasen's “Evening Star”appears, after which on the upper 5-minute chartmBDSR (RCI two-filter) sell signalslight up and the price declines smoothly.
From this example,the trade method focusing on the Lasen’s “Evening Star” in the Lasen五法andthe signals of mBDSRshow a high level of compatibility.
Indicator that shines in combination with RCI【BODSOR・mBDSR】
and methods / case studies (PDF) ★GogoJungle AWARD2020 winner★
https://www.gogojungle.co.jp/tools/indicators/11836
301 PDF files are included.
Most of them are examples summarized as using three RCI lines to logically link higher and lower timeframes, examining multiple lower-timeframe situations sequentially, and ultimately waiting for a timing to buy on dips or sell on rallies on the lower timeframes (=mBDSR signals)..
Also,many emphasize capturing points where multiple entry reasons coincide..
In the explanations,more than 1,000 chartsare used.

and methods / case studies (PDF) ★GogoJungle AWARD2020 winner★
https://www.gogojungle.co.jp/tools/indicators/11836
The above product includes 301 PDFs (methods, case studies, etc.). For a list of the titles of these PDFs, please see the article below.
About the 301 PDF files included with 【BODSOR・mBDSR】
https://www.gogojungle.co.jp/finance/navi/articles/34271
Pound Aussie GBPAUD 15-minute chart
Looking at the area circled with a white circle on the 15-minute chart above,the Lasen's “Evening Star”appears. This candlestick pattern suggests a bearish reversal, and it may not be unusual to consider selling on pullbacks on a lower time frame.
Pound Aussie GBPAUD 5-minute chart
On the higher-time frame 15-minute chart,the Lasen's “Evening Star”appears, after which on the upper 5-minute chartmBDSR (RCI two-filter) sell signalslight up and the price declines smoothly.
From this example,the trade method focusing on the Lasen’s “Evening Star” in the Lasen五法andthe signals of mBDSRshow a high level of compatibility.
Indicator that shines in combination with RCI【BODSOR・mBDSR】
and methods / case studies (PDF) ★GogoJungle AWARD2020 winner★
https://www.gogojungle.co.jp/tools/indicators/11836
301 PDF files are included.
Most of them are examples summarized as using three RCI lines to logically link higher and lower timeframes, examining multiple lower-timeframe situations sequentially, and ultimately waiting for a timing to buy on dips or sell on rallies on the lower timeframes (=mBDSR signals)..
Also,many emphasize capturing points where multiple entry reasons coincide..
In the explanations,more than 1,000 chartsare used.
× ![]()


