

Triangle consolidation and the signs of R1 R2 S2
Indicator “RCI and mBDSR: Capturing Tops and Bottoms / Reversals”
Methods and Case Studies (PDF) ★GogoJungle AWARD2020 Winner★
https://www.gogojungle.co.jp/tools/indicators/11836
The above products include 301 PDFs (methods, case studies, etc.). For a list of the PDF titles, please see the article below.
About the 301 PDF files included with 【BODSOR・mBDSR】
https://www.gogojungle.co.jp/finance/navi/articles/34271
R1R2S2 is included in the above product. For details, please refer to the following Investor Navigator+ article.
RCI trio “Two-stage Decision” Indicator for Catching Trends Shifts, Buy-the-D dip, and Sell-the-Rally: R1R2S2 Released!!
Gold XAUUSD 1-hour chart
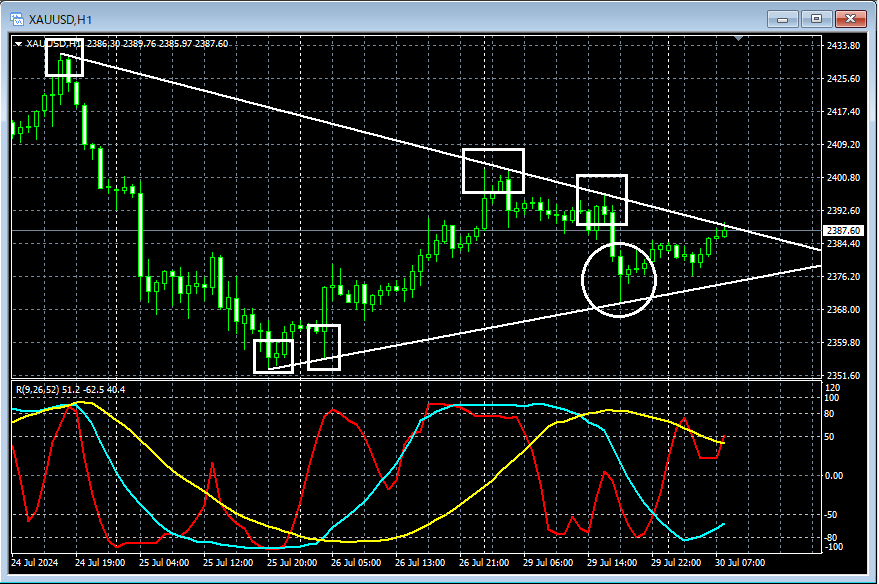
On the 1-hour chart above,a Triangle Consolidationis forming. Looking at the area circled with the white circle,a Triangle Consolidationhas fallen toward the lower end, suggesting it may not be unusual to consider a dip-based buy. We will look for signs of a bullish move on lower timeframes.
Gold XAUUSD 1-minute chart
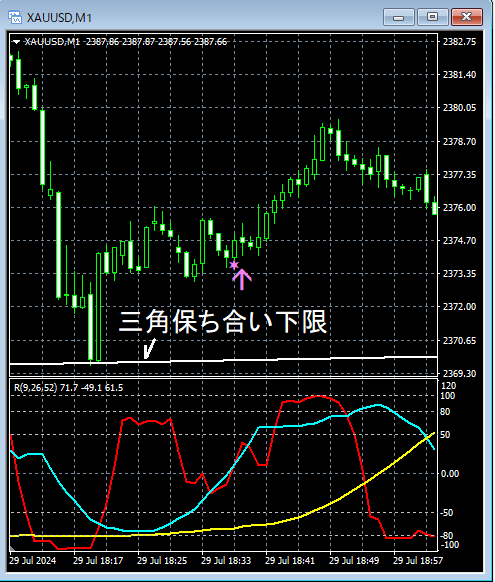
On the 1-minute chart above,a Triangle Consolidationhas fallen toward the lower end and then rebounded, andthe R1R2S2 dip-buy signallights up and the price climbs firmly.
From this example,a trading method focused on triangle consolidationandthe R1R2S2 signalshow a strong synergy.
Indicator that excels in combination with RCI: 【BODSOR・mBDSR】
Methods and Case Studies (PDF) ★GogoJungle AWARD2020 Winner★
https://www.gogojungle.co.jp/tools/indicators/11836
The PDF files include 301 items (over 1,000 pages, over 350,000 characters).
Many of them are examples that logically link higher and lower timeframes using the RCI three-line setup, sequentially examining multiple lower timeframes, and ultimately waiting for lower timeframe dip-buy or pullback timing (the mBDSR signal).They also emphasize capturing points where multiple entry reasons overlap.
The explanations usemore than 1,000 chartsin total.

Methods and Case Studies (PDF) ★GogoJungle AWARD2020 Winner★
https://www.gogojungle.co.jp/tools/indicators/11836
The above products include 301 PDFs (methods, case studies, etc.). For a list of the PDF titles, please see the article below.
About the 301 PDF files included with 【BODSOR・mBDSR】
https://www.gogojungle.co.jp/finance/navi/articles/34271
R1R2S2 is included in the above product. For details, please refer to the following Investor Navigator+ article.
RCI trio “Two-stage Decision” Indicator for Catching Trends Shifts, Buy-the-D dip, and Sell-the-Rally: R1R2S2 Released!!
Gold XAUUSD 1-hour chart
On the 1-hour chart above,a Triangle Consolidationis forming. Looking at the area circled with the white circle,a Triangle Consolidationhas fallen toward the lower end, suggesting it may not be unusual to consider a dip-based buy. We will look for signs of a bullish move on lower timeframes.
Gold XAUUSD 1-minute chart
On the 1-minute chart above,a Triangle Consolidationhas fallen toward the lower end and then rebounded, andthe R1R2S2 dip-buy signallights up and the price climbs firmly.
From this example,a trading method focused on triangle consolidationandthe R1R2S2 signalshow a strong synergy.
Indicator that excels in combination with RCI: 【BODSOR・mBDSR】
Methods and Case Studies (PDF) ★GogoJungle AWARD2020 Winner★
https://www.gogojungle.co.jp/tools/indicators/11836
The PDF files include 301 items (over 1,000 pages, over 350,000 characters).
Many of them are examples that logically link higher and lower timeframes using the RCI three-line setup, sequentially examining multiple lower timeframes, and ultimately waiting for lower timeframe dip-buy or pullback timing (the mBDSR signal).They also emphasize capturing points where multiple entry reasons overlap.
The explanations usemore than 1,000 chartsin total.
× ![]()


