
Rising parallel channel and mBDSR (RCI2 two-filter) signal
Indicator that captures the bottom/top turning points in combination with RCI: 【mBDSR】
Methods and case studies (PDF) ★GogoJungle AWARD 2020 winner★
https://www.gogojungle.co.jp/tools/indicators/11836
The above products include 301 PDF files. For a list of their PDF titles, please refer to the article below.
About the 301 accompanying PDF files for 【BODSOR・mBDSR】
https://www.gogojungle.co.jp/finance/navi/articles/34271
Bitcoin/USD BTCUSD 5-minute chart
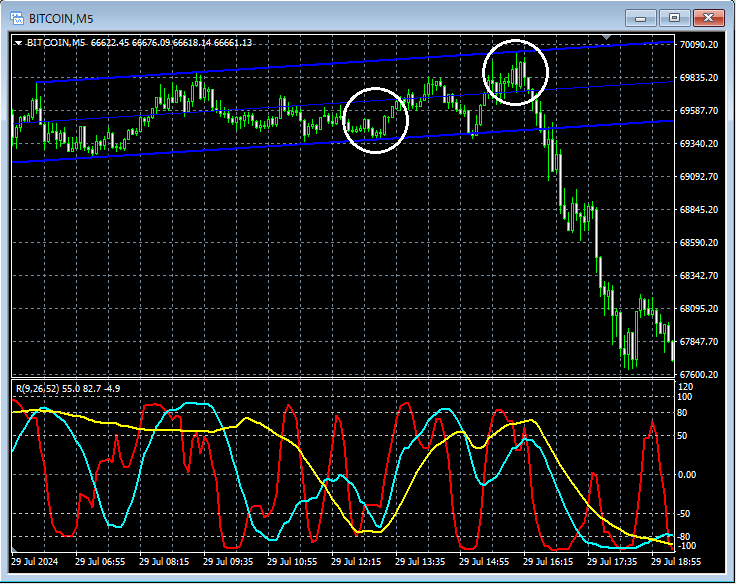
Looking at the 5-minute chart above,a rising parallel channelis formed, exhibiting upward movement with fluctuations. Here, around the circled area in white, we will consider buying on dips near the channel lower bound and selling on rallies near the channel upper bound while viewing the lower time frame charts.
Bitcoin/USD BTCUSD 1-minute chart
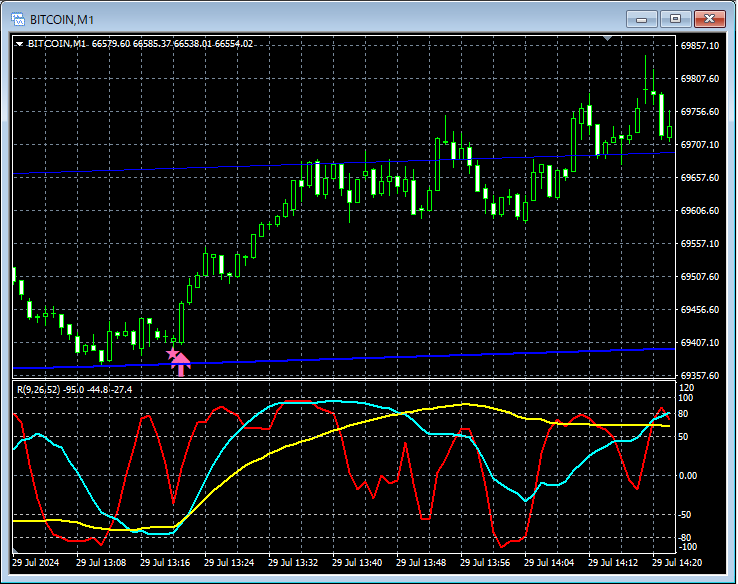
On the above 1-minute chart, near the channel lower boundmBDSR (RCI two-filter) buy-on-dip signallights up at the right timing.
Bitcoin/USD BTCUSD 1-minute chart
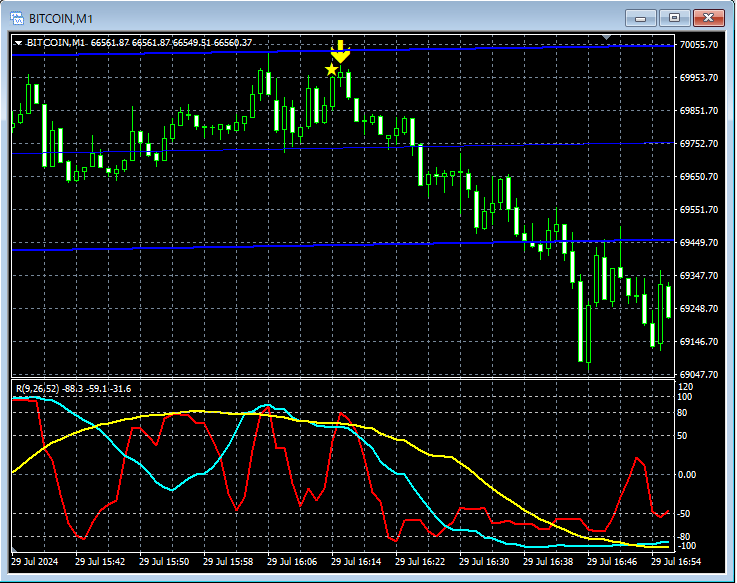
On the above 1-minute chart, near the channel upper boundmBDSR (RCI two-filter) sell-on-rally signallights up at the right timing.
From this example,a trading method focused on parallel channelsandthe signal of mBDSRshow a high degree of compatibility.
Also in this example, placing the stop-loss a little below (above) the most recent low (high)allows for favorable risk-reward tradesby setting the line accordingly.
The indicator that shines in combination with RCI: 【BODSOR・mBDSR】
Methods and case studies (PDF) ★GogoJungle AWARD 2020 winner★
https://www.gogojungle.co.jp/tools/indicators/11836
The PDF files include 301 items (over 1,000 pages, over 350,000 words).
Many of them aresummaries of cases where multiple lower time-frame situations are logically linked with the higher time frame using three RCI lines, ultimately waiting for dips or rallies on the lower time frame (i.e., mBDSR signals).
Additionally,there are many that focus on identifying points where multiple entry reasons overlap..
The explanations usemore than 1,000 charts.

Methods and case studies (PDF) ★GogoJungle AWARD 2020 winner★
https://www.gogojungle.co.jp/tools/indicators/11836
The above products include 301 PDF files. For a list of their PDF titles, please refer to the article below.
About the 301 accompanying PDF files for 【BODSOR・mBDSR】
https://www.gogojungle.co.jp/finance/navi/articles/34271
Bitcoin/USD BTCUSD 5-minute chart
Looking at the 5-minute chart above,a rising parallel channelis formed, exhibiting upward movement with fluctuations. Here, around the circled area in white, we will consider buying on dips near the channel lower bound and selling on rallies near the channel upper bound while viewing the lower time frame charts.
Bitcoin/USD BTCUSD 1-minute chart
On the above 1-minute chart, near the channel lower boundmBDSR (RCI two-filter) buy-on-dip signallights up at the right timing.
Bitcoin/USD BTCUSD 1-minute chart
On the above 1-minute chart, near the channel upper boundmBDSR (RCI two-filter) sell-on-rally signallights up at the right timing.
From this example,a trading method focused on parallel channelsandthe signal of mBDSRshow a high degree of compatibility.
Also in this example, placing the stop-loss a little below (above) the most recent low (high)allows for favorable risk-reward tradesby setting the line accordingly.
The indicator that shines in combination with RCI: 【BODSOR・mBDSR】
Methods and case studies (PDF) ★GogoJungle AWARD 2020 winner★
https://www.gogojungle.co.jp/tools/indicators/11836
The PDF files include 301 items (over 1,000 pages, over 350,000 words).
Many of them aresummaries of cases where multiple lower time-frame situations are logically linked with the higher time frame using three RCI lines, ultimately waiting for dips or rallies on the lower time frame (i.e., mBDSR signals).
Additionally,there are many that focus on identifying points where multiple entry reasons overlap..
The explanations usemore than 1,000 charts.