

[Bitcoin Strategy] From the July 29, 2024 chart: a line connecting the high points on higher timeframes, a double top, and the mbDSR (RCI two-filter) pullback sell signal
0
Indicator that captures “tops/bottoms and reversals” in combination with RCI: 【mBDSR】
Methods, case studies (PDF) ★GogoJungle AWARD2020 winner★
https://www.gogojungle.co.jp/tools/indicators/11836
The above product includes 301 PDFs. For a list of the PDF titles and related information, please see the article below.
Regarding the 301 attached PDF files for 【BODSOR・mBDSR】
https://www.gogojungle.co.jp/finance/navi/articles/34271
mBDSR (RCI filter)andmBDSR (moving average filter)have different roles. The PDF above also discusses how to use them appropriately.
Below,mBDSR (RCI filter)andmBDSR (moving average filter)will be shown with examples of signs from both.
Bitcoin / USD BTCUSD Weekly
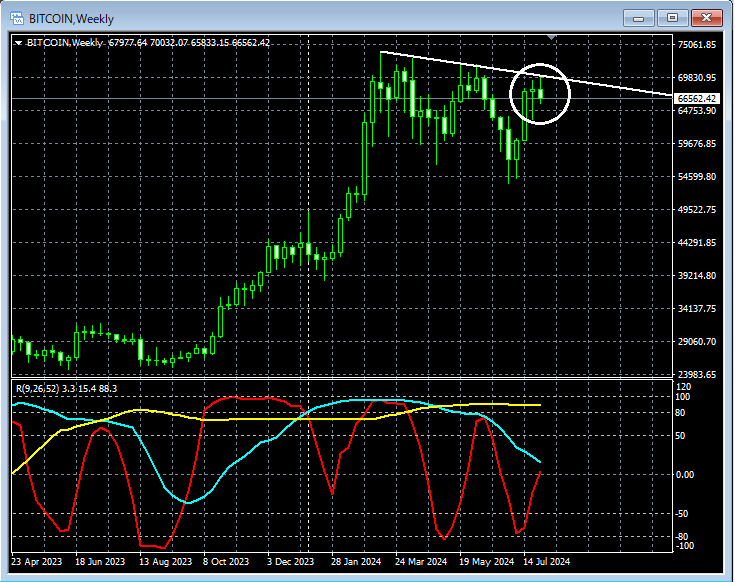
Looking at the area circled in white on the weekly chart above, yesterday the pricerose toward the line connecting the highsnearby. It may not be strange to consider selling on rallies on lower timeframes.
In this example, when looking at lower timeframes,RCI 3-linecan be used to logically drop down from the 4-hour chart to the lower timeframes, but the detailed explanation is in the attached PDF, so it will be omitted here. Here we are looking at the 1-minute chart after examining the weekly chart, not just casually.
Bitcoin / USD BTCUSD 1-minute
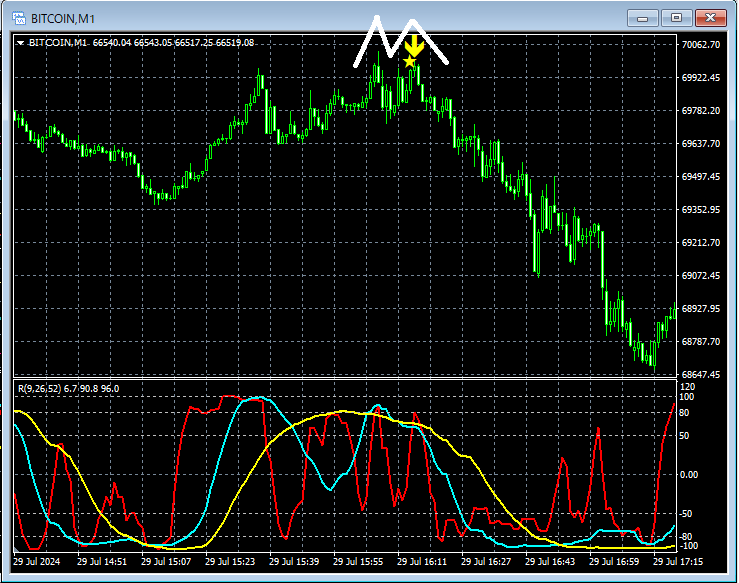
On the above 1-minute chart, around the highs,a double topis formed, and on theright peak of the double topthemBDSR (2-RCI filters) reversal sell signallights up and the price drops sharply.
From this example,a trading method focused on the line connecting the highsandthe harmony with mBDSR signalsis evident.
Reference Bitcoin / USD BTCUSD 5-minute
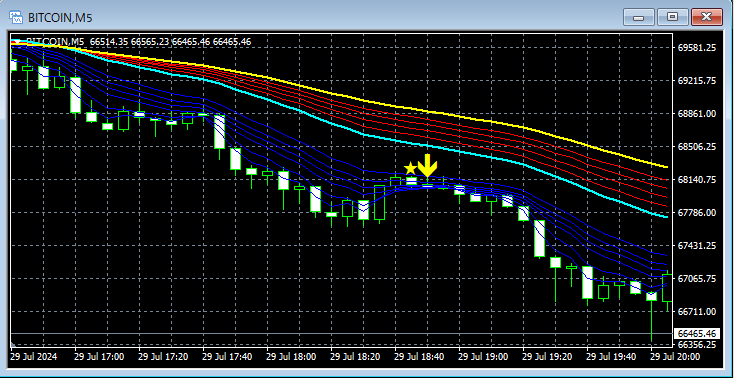
On the above 5-minute chart, there is a display of themBDSR (2-RCI filters) reversal sell signalduring the decline after the 1-minute signalmBDSR (MA 2-filter)signal.MA 2-filter reversal sell signalis functioning effectively.
Powerful indicator when combined with RCI: 【BODSOR・mBDSR】
Methods, case studies (PDF) ★GogoJungle AWARD2020 winner★
https://www.gogojungle.co.jp/tools/indicators/11836
The included PDF files amount to 301 (over 1,000 pages, over 350,000 words).
Many of them aresummaries of the examples that logically link higher and lower timeframes using the RCI 3-line method, ultimately waiting for entries in the lower timeframes (i.e., mBDSR signs) such as buy-the-did lower or pullback entries.
In addition,many focus on identifying points where multiple entry rationales coincide.
The explanations useover 1,000 charts.

Methods, case studies (PDF) ★GogoJungle AWARD2020 winner★
https://www.gogojungle.co.jp/tools/indicators/11836
The above product includes 301 PDFs. For a list of the PDF titles and related information, please see the article below.
Regarding the 301 attached PDF files for 【BODSOR・mBDSR】
https://www.gogojungle.co.jp/finance/navi/articles/34271
mBDSR (RCI filter)andmBDSR (moving average filter)have different roles. The PDF above also discusses how to use them appropriately.
Below,mBDSR (RCI filter)andmBDSR (moving average filter)will be shown with examples of signs from both.
Bitcoin / USD BTCUSD Weekly
Looking at the area circled in white on the weekly chart above, yesterday the pricerose toward the line connecting the highsnearby. It may not be strange to consider selling on rallies on lower timeframes.
In this example, when looking at lower timeframes,RCI 3-linecan be used to logically drop down from the 4-hour chart to the lower timeframes, but the detailed explanation is in the attached PDF, so it will be omitted here. Here we are looking at the 1-minute chart after examining the weekly chart, not just casually.
Bitcoin / USD BTCUSD 1-minute
On the above 1-minute chart, around the highs,a double topis formed, and on theright peak of the double topthemBDSR (2-RCI filters) reversal sell signallights up and the price drops sharply.
From this example,a trading method focused on the line connecting the highsandthe harmony with mBDSR signalsis evident.
Reference Bitcoin / USD BTCUSD 5-minute
On the above 5-minute chart, there is a display of themBDSR (2-RCI filters) reversal sell signalduring the decline after the 1-minute signalmBDSR (MA 2-filter)signal.MA 2-filter reversal sell signalis functioning effectively.
Powerful indicator when combined with RCI: 【BODSOR・mBDSR】
Methods, case studies (PDF) ★GogoJungle AWARD2020 winner★
https://www.gogojungle.co.jp/tools/indicators/11836
The included PDF files amount to 301 (over 1,000 pages, over 350,000 words).
Many of them aresummaries of the examples that logically link higher and lower timeframes using the RCI 3-line method, ultimately waiting for entries in the lower timeframes (i.e., mBDSR signs) such as buy-the-did lower or pullback entries.
In addition,many focus on identifying points where multiple entry rationales coincide.
The explanations useover 1,000 charts.
× ![]()


