

A lower-timeframe double top formed near the neckline of the higher-timeframe double top and the return-sell signal of mBDSR (RCI two-filter)
Indicator that captures “the bottom and reversal” by combining with RCI [mBDSR]
Methods and Case Studies (PDF) ★GogoJungle AWARD2020 winner★
https://www.gogojungle.co.jp/tools/indicators/11836
The above products include 301 PDFs (methods, case studies, etc.). For a list of the PDF titles, please refer to the article below.
About the 301 PDF files included with 【BODSOR・mBDSR】
https://www.gogojungle.co.jp/finance/navi/articles/34271
EUR/GBP 4-hour chart
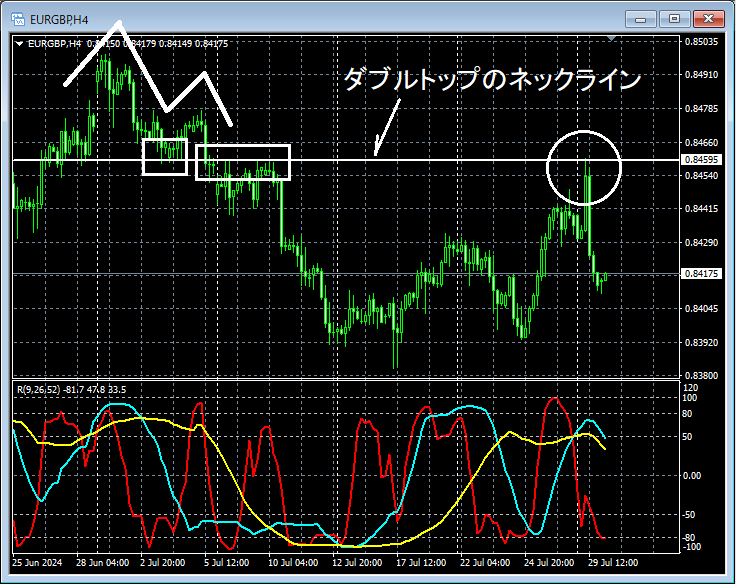
Around the area circled by the white circle on the 4-hour chart above, it has served as resistanceNeckline of the Double Tophas risen up to the vicinity, and considering selling on a pullback may not be unreasonable. We will look at it in more detail on a lower timeframe.
In this example, when looking at the lower timeframe,Using the RCI three-line filterallows logically dropping down from the 4-hour chart to lower timeframes sequentially, but detailed explanations are in the accompanying PDFs, so I will omit them here. Below, we look at the 1-minute chart, noting that this is not simply a random viewing after checking the 4-hour chart.
EUR/GBP 1-minute chart
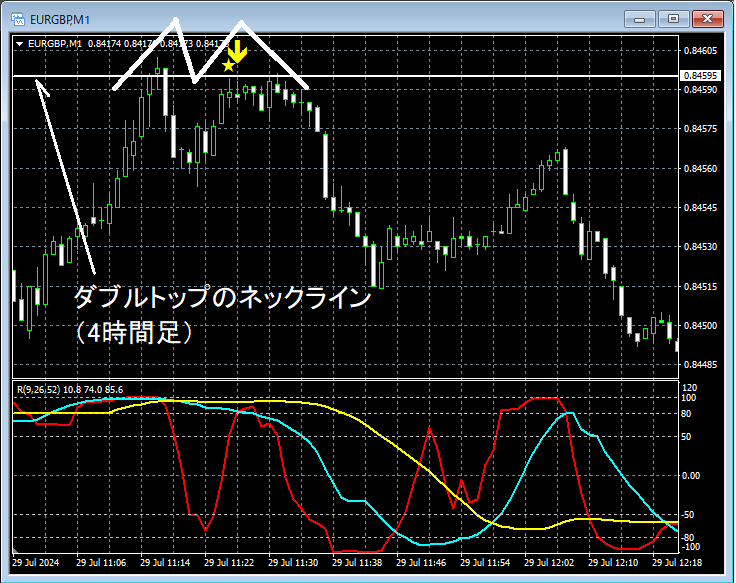
On the 1-minute chart above, the right side of theDouble Top Necklineon the 4-hour chart forms aDouble Topon the right-hand peak,the mBDSR (RCI two-line filter) sell signallights up and the price declines firmly.
From this example,the trading method that focuses on the Double Top and its necklineandthe compatibility with mBDSR signalsis evident.
Additionally, in this example, placing a stop-loss slightly above the left peak of the Double Topallows for a favorable risk-reward trade.
Indicator that shines in combination with RCI【BODSOR・mBDSR】
Methods and Case Studies (PDF) ★GogoJungle AWARD2020 winner★
https://www.gogojungle.co.jp/tools/indicators/11836
A total of 301 PDF files are included.
Many of them describe how to logically link higher and lower timeframes using the RCI three-line filter, examining multiple lower-timeframe situations sequentially, and ultimately waiting for a timing to buy on strength or sell on pullbacks (i.e., the mBDSR signal) on the lower timeframesAdditionally,
there are many that emphasize capturing points where multiple entry reasons overlap.
The explanations useover 1,000 charts.

Methods and Case Studies (PDF) ★GogoJungle AWARD2020 winner★
https://www.gogojungle.co.jp/tools/indicators/11836
The above products include 301 PDFs (methods, case studies, etc.). For a list of the PDF titles, please refer to the article below.
About the 301 PDF files included with 【BODSOR・mBDSR】
https://www.gogojungle.co.jp/finance/navi/articles/34271
EUR/GBP 4-hour chart
Around the area circled by the white circle on the 4-hour chart above, it has served as resistanceNeckline of the Double Tophas risen up to the vicinity, and considering selling on a pullback may not be unreasonable. We will look at it in more detail on a lower timeframe.
In this example, when looking at the lower timeframe,Using the RCI three-line filterallows logically dropping down from the 4-hour chart to lower timeframes sequentially, but detailed explanations are in the accompanying PDFs, so I will omit them here. Below, we look at the 1-minute chart, noting that this is not simply a random viewing after checking the 4-hour chart.
EUR/GBP 1-minute chart
On the 1-minute chart above, the right side of theDouble Top Necklineon the 4-hour chart forms aDouble Topon the right-hand peak,the mBDSR (RCI two-line filter) sell signallights up and the price declines firmly.
From this example,the trading method that focuses on the Double Top and its necklineandthe compatibility with mBDSR signalsis evident.
Additionally, in this example, placing a stop-loss slightly above the left peak of the Double Topallows for a favorable risk-reward trade.
Indicator that shines in combination with RCI【BODSOR・mBDSR】
Methods and Case Studies (PDF) ★GogoJungle AWARD2020 winner★
https://www.gogojungle.co.jp/tools/indicators/11836
A total of 301 PDF files are included.
Many of them describe how to logically link higher and lower timeframes using the RCI three-line filter, examining multiple lower-timeframe situations sequentially, and ultimately waiting for a timing to buy on strength or sell on pullbacks (i.e., the mBDSR signal) on the lower timeframesAdditionally,
there are many that emphasize capturing points where multiple entry reasons overlap.
The explanations useover 1,000 charts.
× ![]()


